Power BI vs Tableau: A Detailed Comparative Guide to Data Visualization
Table of contents
- Power BI and Tableau: Platform Overviews
- A brief overview of Power BI and Tableau as market leaders
- What is Microsoft Power BI?
- What is Tableau?
- Comparison of Key BI Tool Aspects
- User Interface and dashboards
- Data visualization
- Customization
- Security
- Sharing and collaboration
- Deployment
- Learning curve
- Data modeling and transformation
- Real-world use cases
- Cost
- Conclusion: Choosing the Optimal BI Tool
- Recommendations for Choice:
In an era of exponential data growth, the opportunity to effectively collect, analyze, and interpret information has become critical for business survival and growth. Business Intelligence is central in this process, enabling organizations to convert raw data into actionable insights. These insights power strategic and operational decisions, streamline processes, uncover new market opportunities, and sharpen the competitive advantage. Without the right BI tools, even the most extensive data sets remain dormant assets, failing to generate real value.
This guide offers an in-depth comparison of Microsoft Power BI and Tableau — two of the leading BI platforms on the market. Choosing between them is more than a technical decision; it's a strategic move that shapes how your organization leverages data, adapts to change, and competes in the long run. Beyond functionality, this comparison explores the broader business implications of each tool. We'll evaluate key aspects such as user interface, visualization capabilities, data modeling, security, integration, pricing, and more, empowering business leaders, IT managers, and analysts to select the solution that best fits their needs and future vision.
It's fascinating how both tools, despite being market leaders, cater to different needs and priorities. Power BI's deep integration with the Microsoft ecosystem truly makes it a no-brainer for companies already invested there, while Tableau's unparalleled 'visual storytelling' capabilities make it shine for client-facing presentations where visual impact is paramount. - Eric Johnson, Marketing Expert, Emerline
Power BI and Tableau: Platform Overviews
A brief overview of Power BI and Tableau as market leaders
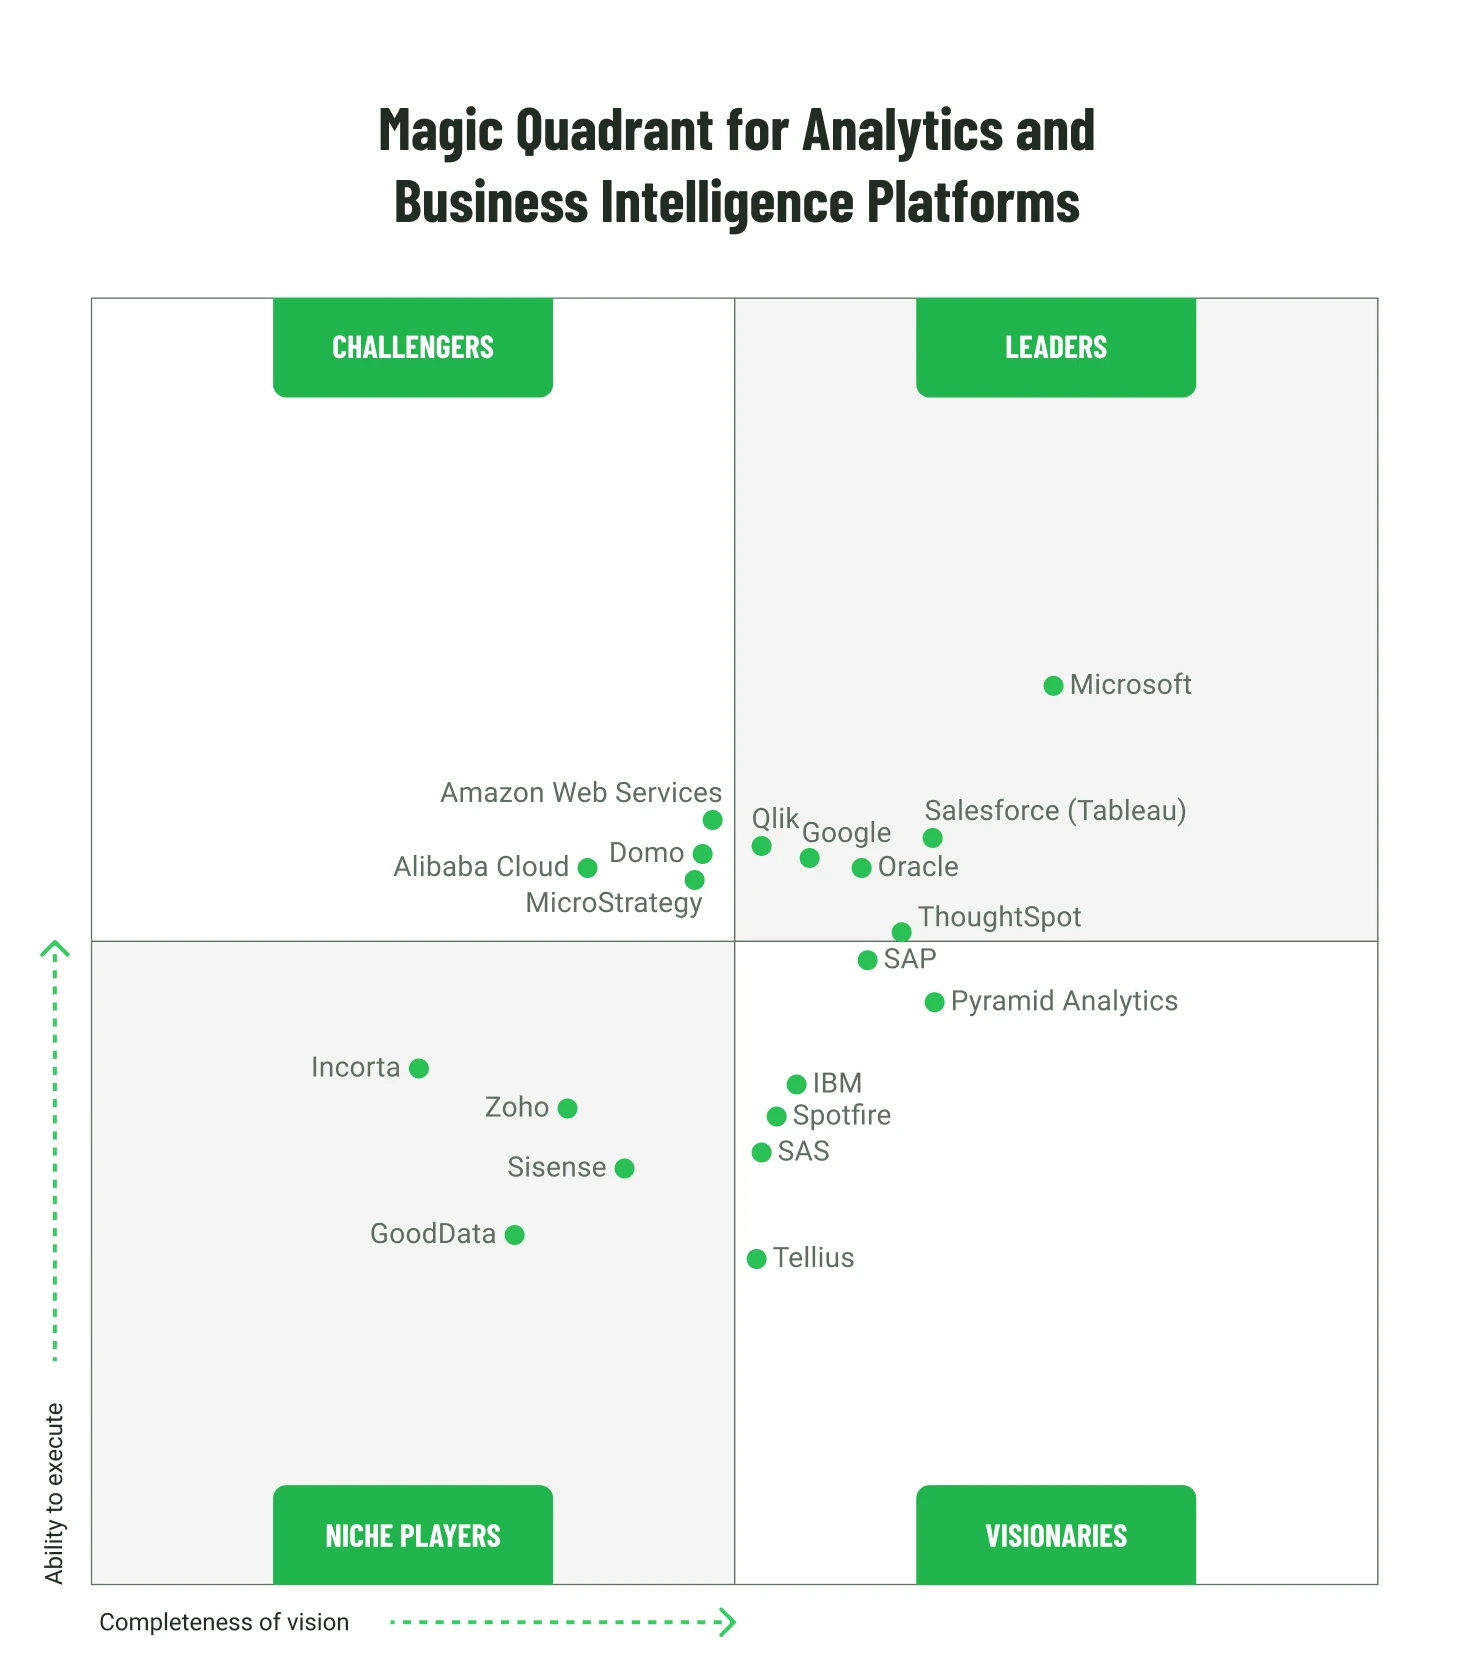
In the contemporary business intelligence landscape, two platforms stand out for their influence and widespread adoption: Microsoft Power BI and Tableau, now part of Salesforce. Both systems have established themselves as robust solutions for data visualization and business intelligence, offering extensive capabilities for connecting to diverse data sources, performing in-depth analysis, and presenting information in intuitive, interactive reports and dashboards. Their market dominance is driven by continuous innovation, broad functionality, and the ability to meet the needs of various user categories, from business analysts to senior executives. In 2025, Microsoft Power BI holds a 19.91% share of the business intelligence market, while Tableau Software holds 16.36%.
What is Microsoft Power BI?
Microsoft Power BI is an interactive data visualization application developed by Microsoft that primarily focuses on business intelligence. It is integrated into the broader Microsoft Power Platform, as well as being a key part of Microsoft Fabric, combining various software services, applications, and connectors to transform data from diverse sources into static and interactive visualizations. The platform allows data input directly from databases, web pages, PDF files, or structured files such as spreadsheets, CSV, XML, JSON, and SharePoint. Power BI provides both cloud-based BI services, known as "Power BI Services," and a desktop application, "Power BI Desktop," for designing and publishing reports.
Initially, Power BI was based on Microsoft Excel add-ins such as Power Query, Power Pivot, and Power View. Over time, Microsoft significantly expanded its functionality, adding natural language Q&A capabilities, enterprise data connectivity, and security options via Power BI Gateways. Power BI also actively leverages artificial intelligence capabilities, allowing users to gain insights through advanced data analysis tools, instantly create reports, and get answers to conversational queries with features like Copilot. The platform promotes the creation of a single source of truth for data through the centralized OneLake hub, enabling analytical capabilities to scale to thousands of users.
Power BI's deep integration with the Microsoft ecosystem, including Microsoft 365, Azure, and Dynamics 365, is one of its most significant aspects. This integration provides a seamless user experience and significantly lowers adoption barriers for companies already heavily using Microsoft products. This situation contributes to faster Power BI implementation and reduced training costs, as users are already familiar with the general interface and operational logic. However, this deep integration can also create an inevitable vendor lock-in, which may be undesirable for organizations seeking multi-cloud or vendor-agnostic strategies. Such a dependency could limit their future flexibility if they need to use solutions from other providers or change their overall IT strategy.
What is Tableau?
Tableau is a leading business intelligence and data visualization tool designed to make data analysis accessible and intuitive for users of varying skill levels. It allows organizations to transform raw data into interactive and shareable dashboards, generating valuable insights that drive informed decision-making. Unlike many traditional BI tools requiring extensive technical knowledge, Tableau prioritizes ease of use, allowing technical and non-technical professionals to create complex visualizations and analyses easily.
Tableau supports many data sources, including spreadsheets, databases, and cloud services such as Google Sheets, Google Analytics, Amazon Athena, Salesforce, SQL Server, Presto, Dropbox, MemSQL, and Hadoop. Its key drag-and-drop functionality significantly simplifies the creation of charts, graphs, and dashboards, making data more understandable and applicable. Tableau is known for its ability to efficiently process massive amounts of data (millions of rows) and offer advanced analytical functions such as forecasting, trend analysis, clustering, and regression analysis. The Tableau product line includes Tableau Desktop (for analysis and visualization creation), Tableau Prep Builder (for data preparation), and Tableau Server/Online (for deployment and sharing). Additionally, Tableau supports natural language queries through other AI features, like the Tableau agent, simplifying data interaction for users without programming skills.
Tableau positions itself as a visualization tool and a means for "telling stories" with data. This is evident in its ability to "choreograph a kind of dance between millions... of lines of data and the visual elements that represent them," creating a "narrative" that allows even non-data specialists to grasp the whole picture. This approach goes beyond simply displaying numbers, emphasizing aesthetics, interactivity, and the ability to convey complex insights to a broad audience. For companies where data presentation is as strategically significant as the data itself, for example, in marketing agencies creating client reports, or for internal presentations to senior management, Tableau's capability can be a key competitive advantage, as the quality and interactivity of visualizations directly influence decision-making and the perception of value.
Comparison of Key BI Tool Aspects
It is not easy to make a well-informed decision when choosing a BI tool. To make it less challenging, we've compiled a side-by-side comparison of Microsoft Power BI and Tableau, focused on the features and functions that matter most. From interface usability and data visualization power to security, scalability, and total cost of ownership, this comparison offers a clear snapshot of how each platform performs. Use it as a strategic reference point to identify the solution that best fits your organization's goals, users, and data ecosystem. It's also worth noting that Power BI can be purchased as a standalone product, without requiring other Microsoft 365 licenses.
| Characteristic | Power BI | Tableau |
| User Interface (UI) | Familiar (like Excel), simple, intuitive, drag-and-drop, suitable for quick reporting. | More flexible, customizable, visually oriented, drag-and-drop, can be more complex for beginners. |
| Data visualization | Robust but simpler, structured visualization. Customization options are limited but can be extended with custom visuals (R/Python, AppSource/SDK) and themes (JSON) for styling. | Advanced, complex, wide range, high degree of customization, "visual storytelling." |
| Customization | Basic options, structured approach, limited flexibility for extensive personalization. | Significantly greater flexibility, advanced capabilities, creation of highly individualized and professional visuals. |
| Security | Azure BLOB/SQL storage, RLS, Azure AD, TLS, MFA, RBAC, data encryption, comprehensive control/auditing. | Customizable settings, predefined roles, RLS, Active Directory/OpenID Connect/SAML 2.0, SSL/TLS, data-at-rest encryption. May lack a centralized approach. |
| Sharing and collaboration | Easy sharing (cloud, email, and embedding into external web resources), real-time collaboration, deeply integrated across all Microsoft services (including Microsoft Teams), auto/manual refresh. | Similar options, Tableau Public, Tableau Server/Online for enterprise sharing, real-time dashboard commenting, on-premises/cloud/hybrid data storage. |
| Deployment | Cloud-first (Azure), but also supports on-premises and hybrid deployments (via Power BI Report Server). Optimal for small/medium datasets, seamless integration with Microsoft services. | Flexible options (cloud, on-premises, hybrid), handles high-volume/high-variability data well, suitable for large enterprises. |
| Learning curve | Gentler, faster to learn for most beginners, especially with Excel experience. | Steeper, especially for advanced analytics/custom visualizations, may require data analysis/programming training (R, Python, SQL). |
| Data modeling and transformation | Power Query Editor (integrated ETL), graphical interface, M language, DAX for complex calculations (steep learning curve). | Tableau Prep Builder (separate tool), visual drag-and-drop interface, VizQL for visual queries, better integration with R/Python for advanced analytics. |
| Performance with Large Data | Can slow down with very large datasets and struggles with scaling, though performance can be improved by giving Power BI more capacity (Premium/Fabric) and optimizing the data model. | Better handles large data volumes, robust data engine, processes millions of rows, no data point/row limits. |
| Ecosystem integration | Deep integration with Microsoft 365, Azure, Dynamics 365, Excel, SharePoint. | Better integration with Salesforce, seamless integration with R/Python, connects to a wide range of data sources. |
| Cost Pro/Creator (monthly) | < $10 (Pro)* | $70 (Creator)* |
| Cost Premium/Pro (monthly) | $20 (Premium Per User), $4,995 (Premium Capacity)* | > $35 (Pro), $12 (Viewer)* |
| Budget orientation | More cost-effective, suitable for startups and SMBs. | More expensive, suitable for large organizations with advanced needs. |
| Free version | Power BI Desktop | Tableau Public |
*Note that prices may change. Data is provided for the first half of 2025.
While our comparison table offers a quick overview, a deeper dive reveals the nuances differentiating Power BI and Tableau. Below, we explore each feature in detail, from user experience and customization flexibility to performance and pricing, to help you better understand how each platform aligns with your organization's specific needs and strategic vision.
User Interface and dashboards
Power BI: Power BI's interface is designed to be as familiar and intuitive as possible for users already working with Microsoft Office products, particularly Excel. Its main dashboard uses a simple drag-and-drop approach, allowing for the easy addition and arrangement of visual elements without requiring deep design or coding knowledge. Power BI dashboards are typically characterized by simplicity and interactivity and are optimally suited for real-time data monitoring. They provide quick and direct access to up-to-date information, making them effective for operational overviews of business metrics.
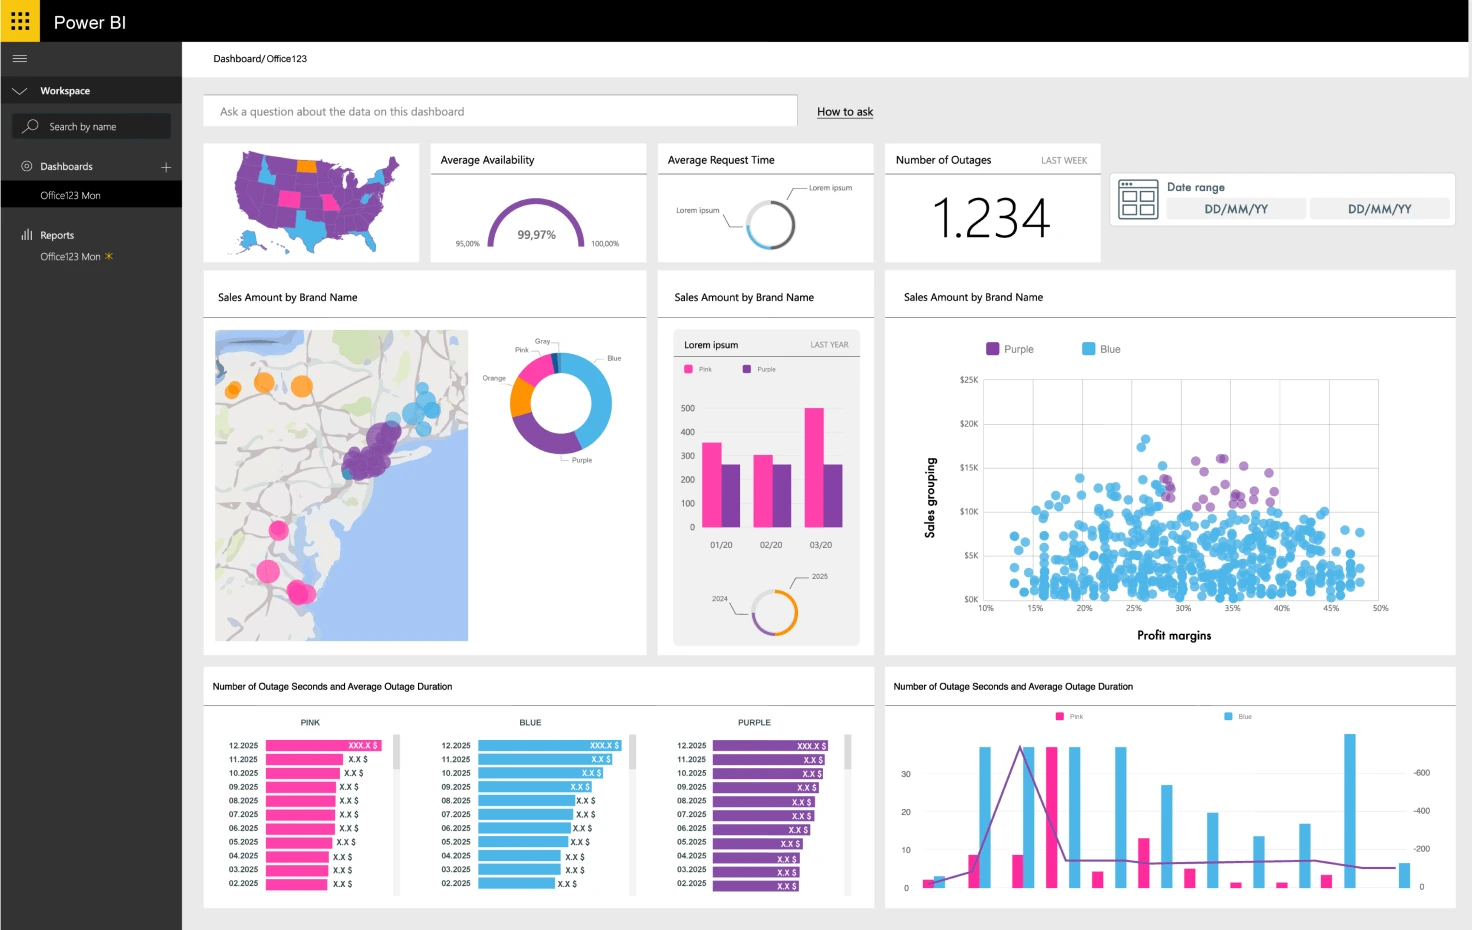
Tableau: Tableau offers a more flexible and customizable interface, allowing users to adapt and design their workspace according to individual preferences. Similar to Power BI, Tableau also uses drag-and-drop functionality to create visualizations. However, its approach to dashboard creation is more detailed and flexible, which can make the interface somewhat more complex for beginners. Tableau dashboards are considered more advanced and customizable, making them particularly suitable for deep, multi-layered data analysis and creating complex visual stories.
The differences in the user interface of these two tools reflect their different target audiences and design philosophies. Power BI is aimed at the mass Microsoft user for operational reporting, which is evident in its simplicity and familiarity. This contributes to faster adoption and reduced training costs, as users can start working with minimal preparation. In contrast, Tableau targets more specialized analysts and data designers, offering unparalleled freedom to create complex, multi-layered, and aesthetically appealing dashboards. Such flexibility is critical for advanced analytical tasks and external presentations where visual impact plays a key role.
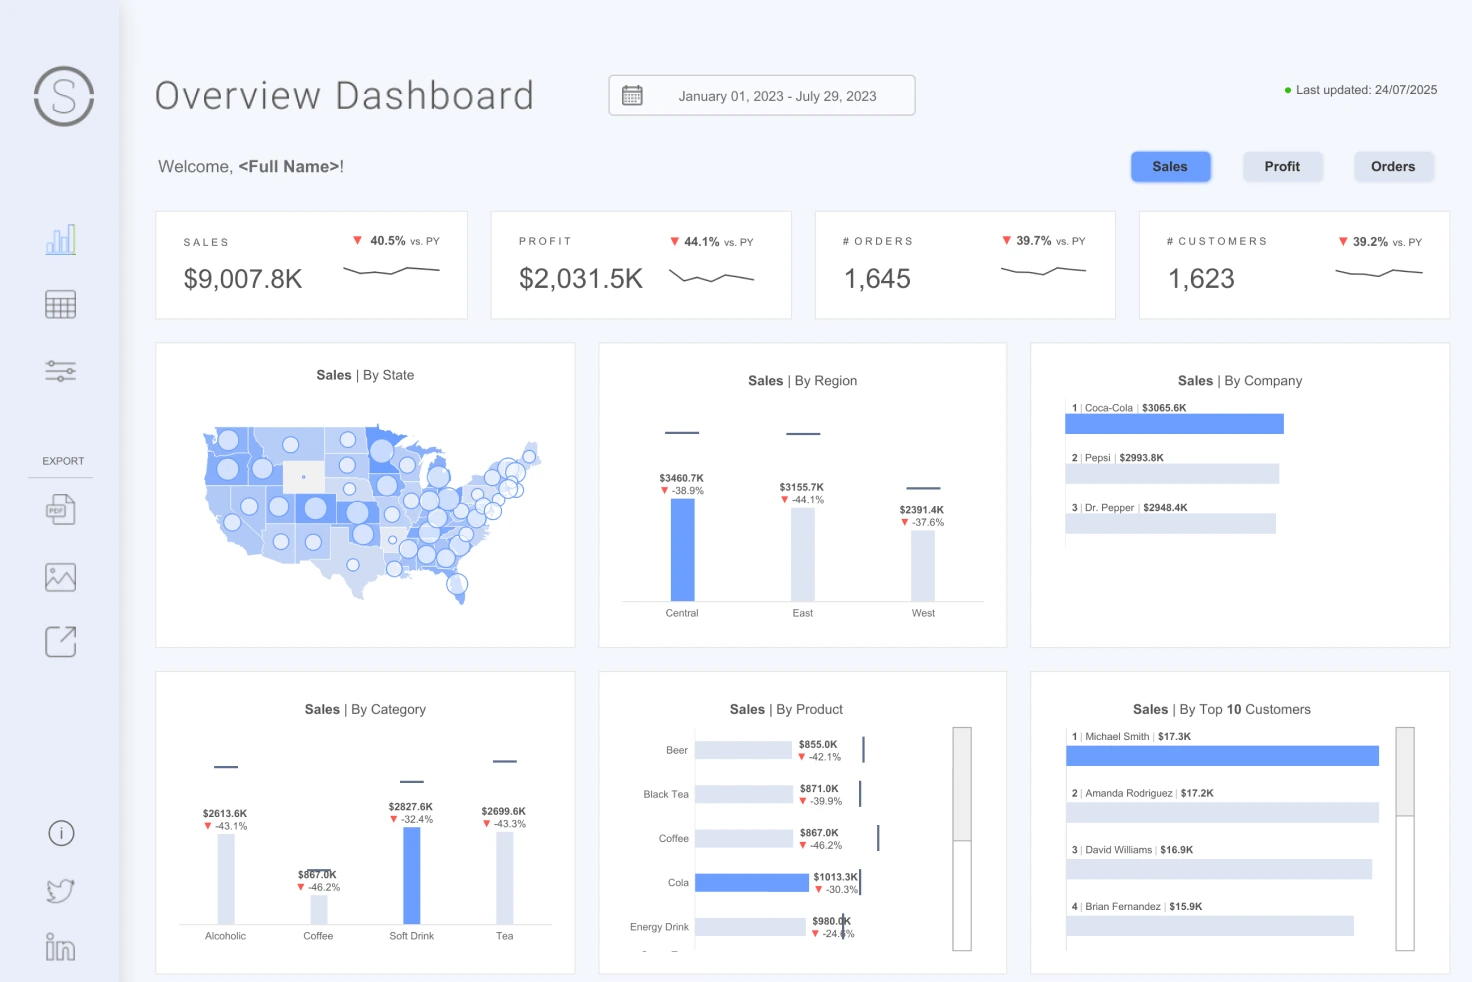
The image is sourced from public.tableau.com
Data visualization
Power BI: Power BI offers robust but relatively simpler visualizations than Tableau. However, its capabilities can be extended by adding custom visuals that are available on a dedicated marketplace. Power BI's primary focus is simplicity and ease of use, providing good basic visualizations suitable for most standard reports. The platform supports the creation of dynamic visualizations, including the ability to use custom elements developed with R and Python.
Tableau: Tableau stands out with its wide variety of advanced and customizable visualizations, providing users greater flexibility and control over data presentation. It is recognized as a leader in creating complex, interactive visual elements and is known for its cutting-edge data visualization capabilities. Tableau can "choreograph" data, transforming it into a coherent narrative, which makes complex information understandable even for non-data specialists.
The choice between Power BI's "good enough" visualization and Tableau's "superior" visualization depends on the strategic value an organization places on data aesthetics and interactivity, as well as the target audience for the reports. Power BI offers functional visualizations that are sufficient for most internal operational reports. However, if the goal is not just to display data but to create a compelling "visual storytelling" that captures attention and deeply engages the audience, Tableau, with its "depth of customization and advanced visualization capabilities," becomes the preferred choice. This is especially relevant for client presentations, marketing campaigns, or strategic reports for senior management, where the quality and interactivity of visualizations directly influence decision-making and the perception of value presented.
Customization
Power BI: Power BI focuses on ease of use and offers basic customization options, making it ideal for quickly creating standard visualizations. It provides a structured approach to customization, which, while user-friendly, may not meet the needs of those seeking extensive personalization and unique design.
Tableau: Tableau offers significantly greater flexibility and advanced customization options, making it a better choice for creating highly individualized and professional visual elements. Tableau stands out for its superior customization options, allowing users to customize almost every aspect of their visualizations, from color schemes to interactive elements and dashboard layouts.
The level of customization required directly indicates an organization's BI maturity and its needs for differentiation and branding of analytical products. Power BI's basic customization is suitable for organizations starting their BI journey or those with standardized reporting needs, where speed and simplicity are more important than unique design. Tableau's deep customization indicates that it is designed for more mature BI practices, requiring unique branding, specific visual narratives, and very detailed interactive elements. This can be critical for companies that use BI as a competitive advantage, provide specialized analytical services, or have strict corporate design guidelines where every visualization element must meet specific standards.
Security
Power BI: Power BI ensures data security using Azure BLOB storage and SQL databases. It offers Row-Level Security (RLS), allowing access to data to be restricted for specific users, ensuring they only see relevant information. Azure Active Directory is used for authentication, and the TLS protocol for secure communication. The platform also provides comprehensive access control, data governance, and auditing capabilities, including multi-factor authentication and role-based access control.
Tableau: Tableau provides customizable security settings, including predefined user roles such as "Viewer," "Interactor," and "Editor," as well as RLS support for administrators. It supports various authentication options, including Active Directory, OpenID Connect, and SAML 2.0. For data encryption, Tableau offers SSL/TLS and data-at-rest encryption. However, some sources note that Tableau may not have a comprehensive, centralized approach to data security, offering primarily only row-level security.
While both tools offer Row-Level Security (RLS), the depth of integration with corporate security systems and the overall security architecture can be crucial for large enterprises with strict compliance requirements and existing IT security infrastructure. As a Microsoft product, Power BI is naturally and deeply integrated with Azure Active Directory and other Microsoft security services. This provides a more unified and potentially easier-to-manage approach to enterprise security for organizations already using the Microsoft ecosystem. Tableau's mentioned limitation regarding a "centralized approach" may mean that while it supports the necessary security features, its management might be more fragmented or require additional effort to integrate with existing enterprise security systems. This is critically important for regulated industries such as finance, healthcare, or companies dealing with highly sensitive personal data, where compliance with regulatory requirements (e.g., GDPR, CCPA) is a priority.
Sharing and collaboration
Power BI: Power BI significantly simplifies the sharing of reports and dashboards through cloud options, email, and embedding in various applications. It offers practical, real-time collaboration features due to deep integration with Microsoft Teams. The platform also supports automatic and manual refreshing of reports and dashboards, ensuring access to the most up-to-date data.
Tableau: Tableau offers similar sharing options, including Tableau Public for free public sharing of visualizations and Tableau Server/Online for enterprise sharing. It allows users to add comments to dashboards in real time, which contributes to improved communication and team productivity. Data for collaboration can be stored either on-premises, in the cloud, or in a hybrid environment.
The effectiveness of collaboration depends not only on the tool's functionality but also on the existing corporate communication platform and the organization's information sharing culture. Power BI's integration with Microsoft Teams is a significant advantage for organizations that already use Teams as their primary platform for communication and collaboration. This allows for seamless embedding of BI insights into daily workflows, reducing time spent switching between applications and facilitating faster feedback. While Tableau also offers commenting features and various deployment options for sharing, its integration with other communication tools may be less deep unless specific connectors are used (although Tableau invests in integrations with Slack and Teams). This means that for companies where cross-functional collaboration and quick feedback are key to operational efficiency, Power BI may offer a more natural and integrated experience.
Deployment
Power BI: Power BI is a cloud-first platform, meaning it is primarily designed to operate in Microsoft Azure's cloud infrastructure. It is optimally suited for working with small to medium-sized datasets, Power BI Premium and Microsoft Fabric capacities enable handling of very large data models. Deploying Power BI in the cloud is typically simpler, and it integrates seamlessly with other Microsoft services, making it an ideal choice for organizations already oriented towards the Microsoft ecosystem.
Tableau: Tableau offers significantly more flexible deployment options, including cloud, on-premises, and hybrid environments. It handles high-volume and high-variability data workloads well, making it suitable for cross-departmental analytics or real-time insights at an enterprise scale. Tableau Server provides all the functionalities of Tableau Cloud and can be deployed on-premises or on any third-party cloud provider.
The choice of deployment model is directly related to an organization's IT strategy, data sovereignty requirements, regulatory restrictions, and the scale of data processed. Power BI, being "cloud-first" and closely tied to Azure, is ideal for companies with a cloud strategy, especially if they already use Azure. This simplifies infrastructure management and can reduce maintenance overhead costs. Tableau, offering "flexible deployment options," including on-premises, is more attractive to organizations with strict data sovereignty requirements (e.g., in Europe or specific industries), companies in regulated industries, or those who prefer complete control over their infrastructure. Additionally, Tableau's ability to handle "high-volume, high-variability data workloads" makes it more suitable for large-scale enterprise deployments where performance on big data is critical, regardless of where that data is stored.
Learning curve
Power BI: Power BI is easier and faster for most beginners to learn, especially if they already have experience with Microsoft products like Excel. Its intuitive interface and drag-and-drop features simplify report and dashboard creation without requiring extensive technical knowledge, allowing business users with minimal technical experience to create informative and interactive reports.
Tableau: Tableau has a steeper learning curve than Power BI, especially regarding advanced analytics and creating custom visualizations. While it also offers a drag-and-drop interface, mastering its advanced features may require training in data analysis and programming (e.g., Python, R, SQL). However, for those willing to invest time in learning, the depth and breadth of analysis offered by Tableau can be significant, providing access to more complex and detailed insights.
Investment in staff training represents a hidden cost that can significantly impact the total cost of ownership (TCO), the speed of BI tool adoption, and the speed of insight generation. Power BI's lower learning curve contributes to a lower TCO and faster user adaptation, leading to quicker extraction of valuable information from data. In contrast, Tableau's steeper learning curve means higher training investments, but potentially opens access to deeper and more complex analytical capabilities for specialized roles that can derive maximum benefit from its extended functionality.
Data modeling and transformation
Power BI: Power BI integrates the Power Query Editor, a powerful data cleaning and transformation tool. This editor provides a graphical interface that allows users to perform complex data preparation tasks without writing SQL code. Functionality includes filtering rows, converting and changing data types, merging and appending queries, and creating custom columns using the M formula language. The Power BI user interface is designed with accessibility, allowing easy switching between data modeling, report building, and data transformation tasks without complex queries or code. Power BI uses the DAX (Data Analysis Expressions) language for data manipulation and complex calculations, which is a powerful tool but can have a steep learning curve.
Tableau: Tableau uses Tableau Prep Builder for data preparation, offering a visual drag-and-drop interface for combining, shaping, and cleaning data for analysis. This tool simplifies the data preparation, making it faster and more intuitive. Tableau Prep Builder supports connection to a wide range of data sources. Unlike Power BI, Tableau focuses more on visualization than deep data modeling within the core product. For visual queries, Tableau uses its unique VizQL language. The platform also includes advanced analytical functions such as forecasting, trend analysis, clustering, and regression analysis, and offers more seamless integration with R and Python for extended analytics.
Differences in data modeling and transformation approaches reflect different data preparation philosophies. Power BI integrates ETL (Extract, Transform, Load) functionality directly into the tool via Power Query, making it accessible to business users. This simplifies end-to-end workflows and reduces reliance on separate tools or specialized roles. Tableau, in contrast, separates this process, offering Tableau Prep Builder as a distinct tool for data preparation. While this may add an extra step to the workflow, Tableau Prep Builder provides more capabilities for dedicated data engineers, allowing them to perform more complex and detailed transformations. This impacts workflow efficiency and the need for specialized roles within the analytical team.
Real-world use cases
An analytical perspective on this comparison emphasizes that the 'better' tool truly depends on your specific organizational context, from your existing tech stack to your budget and desired level of data visualization sophistication. This is particularly evident when examining the real-world use cases, which are designed to illustrate how distinct business scenarios often lead to different optimal choices. - Eric Johnson, Marketing Expert, Emerline
Power BI: Power BI is an ideal choice for mid-sized companies that need to track sales KPIs across various departments. For example, a company with approximately 250 employees, including regional sales teams and a small operations staff, heavily using Microsoft 365, can effectively track KPIs such as lead-to-close time, quota attainment, and sales representative performance. Power BI seamlessly connects with existing Microsoft tools like Excel and SharePoint, and integrates smoothly into Microsoft Teams for easy information sharing. This ensures accessibility and cost-effectiveness, especially for Microsoft 365 subscribers, as well as quick launch and a minimal learning curve for teams already familiar with Excel. Power BI is well-suited for internal operational reporting and finance, operations, and compliance departments, where accuracy and repeatability are valued.
Tableau: Tableau is particularly well-suited for digital marketing agencies that must create client-facing dashboards requiring custom branding, visual appeal, and high interactivity. For example, an agency managing campaign performance for multiple clients can use Tableau to create dashboards that reflect each client's specific branding and effectively highlight key results, such as audience growth, campaign ROI, and engagement metrics by region. Tableau allows for creating polished, branded visuals and including rich interactive elements such as filters, drill-downs, and geospatial mapping, which can be securely distributed via Tableau Cloud. For agencies where the visual presentation of data is as crucial as the performance metrics, Tableau helps transform data into a valuable design asset.
Hybrid/Complex Scenarios: For enterprise-level businesses with a complex technology environment, including both on-premises databases and cloud applications (e.g., Snowflake and Salesforce), as well as diverse needs across different departments (e.g., the finance team needs precise, scheduled reports; the marketing team requires real-time campaign analytics; and the IT department prioritizes data governance and scalability). In such scenarios, relying on a single platform may not be sufficient. The solution could involve using both Power BI and Tableau, or, more effectively, adopting a flexible, modern platform capable of unifying data across various tools, departments, and sources without requiring trade-offs.
Alignment with business needs and the existing technology stack is a key factor in choosing a tool. Power BI excels where integration with the Microsoft ecosystem and internal operational reporting are paramount. Tableau shines where visual storytelling, client presentations, and advanced data exploration play a crucial role. Hybrid scenarios highlight the need for flexible data platforms that adapt to complex and diverse IT environments.
Cost
Power BI: Power BI generally offers a more cost-effective solution. There is a free desktop version. Power BI Pro costs less than $10 per month per user, with an annual subscription approaching $100. For larger organizations or those needing dedicated resources, Power BI Premium is available at $4,995 per month or $20 per user per month for the Premium Per User version. Due to its affordable price, Power BI is often the preferred choice for startups and small and medium-sized businesses (SMBs), especially if they already use Microsoft 365.
Tableau: Tableau is generally more expensive than Power BI. The Tableau Pro version costs over $35 per month per user, with annual fees approaching $1000. More specific products include Tableau Creator, which costs $70 per month, and Tableau Viewer, which costs $12 per month. Tableau's higher cost is often associated with its steeper learning curve.
Note that prices may change. Data is provided for the first half of 2025.
When comparing costs, it's important to consider not only licensing fees but also the total cost of ownership (TCO), which includes training, integration, and maintenance costs. Power BI's lower licensing fees and easier learning curve often lead to a lower TCO for Microsoft-centric organizations. Tableau's higher price is justified by its advanced capabilities and flexibility for specific, high-value use cases where the depth of data visualization and analysis brings significant business value.
Conclusion: Choosing the Optimal BI Tool
The choice between Microsoft Power BI and Tableau is not a question of which tool is "better" in an absolute sense but rather which tool optimally aligns with a specific organization's unique needs, existing infrastructure, budget, and strategic goals. Both solutions are leaders in business intelligence and data visualization, offering powerful functionality but with different emphases and philosophies.
Power BI stands out for its deep integration with the Microsoft ecosystem, making it a natural choice for companies actively using Microsoft 365, Azure, and Dynamics 365 products. Its user interface, familiar from Excel, provides a gentler learning curve and rapid adoption of self-service BI across broad organization segments, reducing training costs and accelerating insight generation. Power BI offers robust visualizations and practical collaboration features, primarily through Microsoft Teams, which facilitates seamless embedding of analytics into daily workflows. From a cost perspective, Power BI is a more economical solution, making it attractive for startups and small and medium-sized businesses. It is ideal for internal operational reporting and scenarios where speed and simplicity are essential.
Tableau, in contrast, positions itself as a tool for "telling stories" with data, offering unparalleled depth of customization and advanced visualization capabilities. Its ability to create complex, aesthetically pleasing, and highly interactive dashboards makes it preferable for scenarios where visual impact and the quality of data presentation are strategically significant, such as for client reports or marketing campaigns. Tableau demonstrates high performance when working with large volumes of data and offers flexible deployment options (cloud, on-premises, hybrid), making it suitable for large enterprises with diverse infrastructure and data sovereignty requirements. Although its learning curve is steeper, the investment in training can be justified for specialized analysts who require maximum flexibility and depth of analysis.
Recommendations for Choice:
- For organizations deeply integrated into the Microsoft ecosystem and focused on operational reporting: Power BI will likely be the most effective and cost-efficient choice. Its seamless integration, familiar interface, and affordable cost will ensure rapid adoption and widespread use of BI capabilities.
- For companies where visual storytelling, in-depth exploratory analysis, and high-quality client presentations are critically important: Tableau, despite its higher cost and steeper learning curve, will provide the necessary level of flexibility and visual excellence.
- For large enterprises with complex, hybrid IT infrastructure and diverse data needs: A hybrid approach may be required, leveraging the strengths of both tools or investing in more flexible, unified data platforms capable of integrating data from various sources.
Regardless of the chosen tool, successful BI solution implementation requires strategic planning, a deep understanding of business processes, and a skilled team. Be sure to contact our specialists to receive a personalized assessment and expert consultation on selecting and implementing the optimal BI tool that aligns with your unique business goals. Emerline is ready to be your partner, guiding you through every step of the BI solution implementation process. Our expertise extends to comprehensive Power BI Consulting and Tableau Consulting, ensuring you leverage the full potential of these leading platforms.
Published on Jul 25, 2025