Microsoft Fabric: The Complete Guide to a Unified Analytics Platform
Table of contents
- Microsoft Fabric Fundamentals: Architecture, Licensing, and Core Concepts
- The SaaS model vs. traditional deployment
- Understanding Fabric capacity and licensing
- Unified user experience (UX)
- OneLake: The Foundation of a Unified Data Ecosystem
- A single, logical data lake
- Shortcuts: the key to eliminating data duplication
- Embracing the open format: Delta Lake
- Exploring Fabric Workloads: One Platform, Infinite Possibilities
- Data Factory: simplifying data integration and orchestration
- Data Engineering: scalable processing with Spark and Lakehouses
- Data Warehouse: high-performance, capacity-based SQL analytics
- Data Science: from experimentation to production with MLOps
- Databases: unified, scalable data management within Fabric
- Real-Time Intelligence (formerly Real-Time Analytics): instant insights from streaming data
- Power BI: integrated business intelligence
- AI Integration in Microsoft Fabric: Copilot as the New Data Partner
- Automating code generation and data preparation
- Simplifying DAX formulas in Power BI
- Governance, Cost Efficiency, and Collaboration in Microsoft Fabric
- Lower Total Cost of Ownership (TCO)
- Built-in security and governance with Microsoft Purview
- Boosting collaboration across data roles
- Conclusion: The Next Step in Unified Analytics
Modern organizations are experiencing an unprecedented surge in data generation. With every new application, sensor, and customer interaction comes another data source and another analytics challenge. As a result, enterprises are now struggling with data sprawl, where information is scattered across systems, stored in incompatible formats, and processed by a patchwork of disconnected tools.
This fragmentation often results in slower decision-making, duplicated storage costs, and inconsistent insights. Analysts spend more time reconciling datasets than interpreting them, while IT teams face the burden of maintaining numerous platforms that rarely integrate smoothly.
To address this complexity, Microsoft introduced Fabric, a unified Software-as-a-Service (SaaS) analytics platform built to consolidate the entire data lifecycle, from ingestion and transformation to analysis, governance, and visualization. Unlike traditional analytics ecosystems, which are composed of separate services, Fabric provides a single, cohesive environment that integrates data engineering, warehousing, business intelligence (BI), and AI under one umbrella.
In this article, we’ll explore the fundamentals of Microsoft Fabric, including its architecture, licensing, and how it redefines how enterprises manage and utilize their data.
Microsoft Fabric Fundamentals: Architecture, Licensing, and Core Concepts
Microsoft Fabric is designed as a SaaS-first platform, meaning all components are delivered, maintained, and scaled by Microsoft in the cloud. This architectural decision represents a clear departure from traditional on-premises or hybrid analytics solutions, which rely on separate servers, tools, and manual configurations.
At its core, Fabric integrates Microsoft’s data ecosystem into a single, end-to-end service, connecting tools such as Power BI, Azure Synapse, and Data Factory through a shared foundation and unified user experience.
Let’s look more closely at the architectural principles that make this possible.
The SaaS model vs. traditional deployment
The shift from infrastructure-based analytics to a SaaS-native model represents a structural evolution rather than a simple upgrade.
| Aspect | Traditional analytics stack | Microsoft Fabric |
| Deployment | On-premises or hybrid, with multiple disconnected tools | Fully-managed SaaS platform hosted on Azure |
| Maintenance | Manual updates, patching, and version control | Automatic updates and feature rollouts by Microsoft |
| Scalability | Dependent on hardware and local capacity | Elastic scaling through cloud capacity management |
| Integration | Requires custom connectors or middleware | Native interoperability across all Fabric workloads |
| Governance | Governance Decentralized, often inconsistent across tools | Centralized governance and compliance via Microsoft Purview |
The SaaS model reduces operational overhead and unifies governance across Fabric workloads; external sources referenced via Shortcuts still follow your enterprise data policies. For organizations managing multi-cloud or hybrid infrastructures, this uniformity translates into lower complexity and predictable performance.
Understanding Fabric capacity and licensing
Microsoft Fabric’s licensing model is built around capacity units (CUs) — a standardized measure of the computational resources allocated to a workspace. These units determine how much data you can process, how many users can operate simultaneously, and how efficiently workloads perform.
To translate this into practical terms, Microsoft offers SKUs (Stock Keeping Units) — predefined licensing tiers that correspond to specific capacity levels. Each SKU represents a bundle of computing power, measured in CUs, that an organization can purchase according to its data processing needs.
For example:
- A smaller team running lightweight data reports might use an F2 or F4 SKU, offering essential compute capacity.
- Large enterprises managing data warehousing, AI workloads, or advanced analytics may opt for F64 or F128 SKUs, enabling greater parallelism, faster performance, and support for more concurrent users.
Higher SKUs equate to higher performance and throughput, allowing organizations to scale capacity in line with business requirements.
Fabric offers flexible billing options designed to fit different operational strategies:
- Pay-as-you-go — an on-demand model where organizations are billed only for the capacity they use, ideal for teams with variable or project-based workloads.
- Reserved capacity — a pre-purchased model providing a predictable monthly or annual cost, best suited for organizations with steady, high-volume analytics usage.
Both models are managed through Microsoft Azure, providing visibility and control over costs via the Azure portal. This flexibility helps teams balance cost efficiency and performance, scaling compute power up or down as needed without over-provisioning resources.
This capacity model benefits organizations in several ways:
- Unified billing: All Fabric workloads — from Data Factory and Data Warehouse to Power BI — share the same resource pool, simplifying financial management.
- Elastic resource allocation: Compute automatically adjusts to workload demand, maintaining performance consistency even during usage spikes.
- Optimized cost-to-performance ratio: Teams can fine-tune provisioning levels, pausing or reallocating capacity during off-peak hours to reduce expenses.
- Simplified management: With a unified capacity model, organizations can focus on optimizing their data strategy and extracting insights, rather than managing multiple service licenses.
In practice, a company that runs data pipelines, hosts a data warehouse, and builds BI dashboards can now operate under a single, predictable resource plan, rather than juggling multiple agreements for storage, compute, and reporting services.
For end users, Fabric continues to support the familiar Power BI license tiers — Free, Pro, and Premium Per User — which determine access, sharing, and collaboration rights. Behind the scenes, however, it’s the Fabric capacity (and the chosen SKU) that powers the entire analytics experience.
|
As Microsoft notes in its Fabric documentation, this unified model streamlines cost predictability and operational efficiency by eliminating redundant licensing across analytics workloads. |
Unified user experience (UX)
One of Fabric’s strongest differentiators lies in its consistent user interface. Instead of switching between separate portals for data engineering, ETL, and BI, users work within a single Fabric interface, designed to bridge both technical and business roles.
The Fabric UI unifies workflows across:
- Data Factory for data integration and transformation.
- Data Engineering for Spark-based processing and Lakehouse creation.
- Data Warehouse for SQL-based modeling and analytics.
- Power BI for visualization and business reporting.
- Data Integration for connecting diverse sources and orchestrating end-to-end data flows.
- Real-Time Intelligence for streaming analytics and event-driven insights.
- Data Science for advanced analytics, machine learning, and AI model development.
- Databases for managing structured data and enabling high-performance querying.
- Data Lakes for centralized, scalable storage of structured and unstructured data.
This unified UX provides tangible productivity advantages:
- Faster onboarding: Teams familiar with Power BI can easily transition to other Fabric workloads.
- End-to-end visibility: Data lineage is traceable from ingestion to the dashboard, all within the environment.
- Built-in Copilot integration: AI assistance is embedded throughout, from generating DAX queries to automating pipeline setup.
Together, these principles make Fabric not only a technical platform but also a strategic enabler of data culture. It enables organizations to democratize access to analytics while maintaining enterprise-grade control and governance.
OneLake: The Foundation of a Unified Data Ecosystem
At the heart of Microsoft Fabric lies OneLake, a unified, enterprise-grade data lake that serves as the single source of truth for all organizational data. Often referred to as the “OneDrive for data,” OneLake provides a centralized and governed hub where every dataset, table, or file, regardless of origin, can coexist under one logical namespace.
Traditional data architectures often rely on fragmented lakes and warehouses scattered across departments and environments, each with its own access rules and duplication risks. This fragmentation leads to data sprawl, redundant copies, and inconsistent analytics outcomes. OneLake addresses this long-standing challenge by consolidating all organizational data under a unified, multi-tenant SaaS environment, ensuring that all Fabric workloads operate on a shared, consistent data foundation.
A single, logical data lake
OneLake automatically connects all Fabric experiences, including Data Engineering, Data Factory, Data Science, Data Warehouse, and Power BI, without requiring additional setup. This design allows any user, from a data scientist to a business analyst, to access and work with the same datasets simultaneously.
Each tenant has one OneLake that spans all workspaces. Data resides in the capacity region(s) you configure; multi-geo is supported when enabled. The system employs logical isolation, not physical duplication, ensuring consistent performance while maintaining strict data governance and compliance.
Shortcuts: the key to eliminating data duplication
OneLake introduces an elegant feature known as Shortcuts, which serves as a bridge between datasets across different domains and storage systems. Instead of copying or moving large volumes of data — a process that traditionally consumes time, storage, and compute resources — Shortcuts allow users to reference external datasets directly, keeping them accessible as if they were stored locally in OneLake.
For example, suppose a company stores operational data in Azure Data Lake Storage (ADLS) and customer data in Amazon S3. In that case, OneLake can establish shortcuts to both, presenting them within a unified structure. The underlying data remains in its original location, but Fabric workloads can process it seamlessly, without the need for complex migration pipelines or synchronization scripts.
The result:
- No unnecessary data replication
- Faster access to distributed datasets
- Reduced storage costs and operational overhead
- Consistent governance and lineage tracking across data sources
This “logical data virtualization” is what makes OneLake a crucial foundation for enterprise-scale analytics, particularly in hybrid or multi-cloud environments where data diversity is the norm.
Embracing the open format: Delta Lake
In line with Microsoft’s vision for open data ecosystems, OneLake adopts Delta Lake, an open-source storage framework based on the Apache Parquet file format. Delta Lake provides ACID transaction guarantees, schema enforcement, and version control. These capabilities transform traditional data lakes into reliable, production-ready data systems.
Delta Lake ensures that all workloads in Fabric, whether batch ETL, Real-Time Intelligence, or BI reporting, can read and write data consistently without conversion or compatibility issues. Interoperates with engines that read Delta/Parquet (e.g., Databricks, Apache Spark). Other platforms (e.g., Snowflake) connect via connectors/external tables depending on format support.
In practical terms, this means that data written once into OneLake in Delta format can be consumed across multiple environments without requiring translation layers or reformatting, thereby greatly simplifying the data lifecycle and facilitating cross-platform analytics.
The open data format approach is key to ensuring that Fabric remains “extensible, future-proof, and interoperable across the modern analytics ecosystem.”
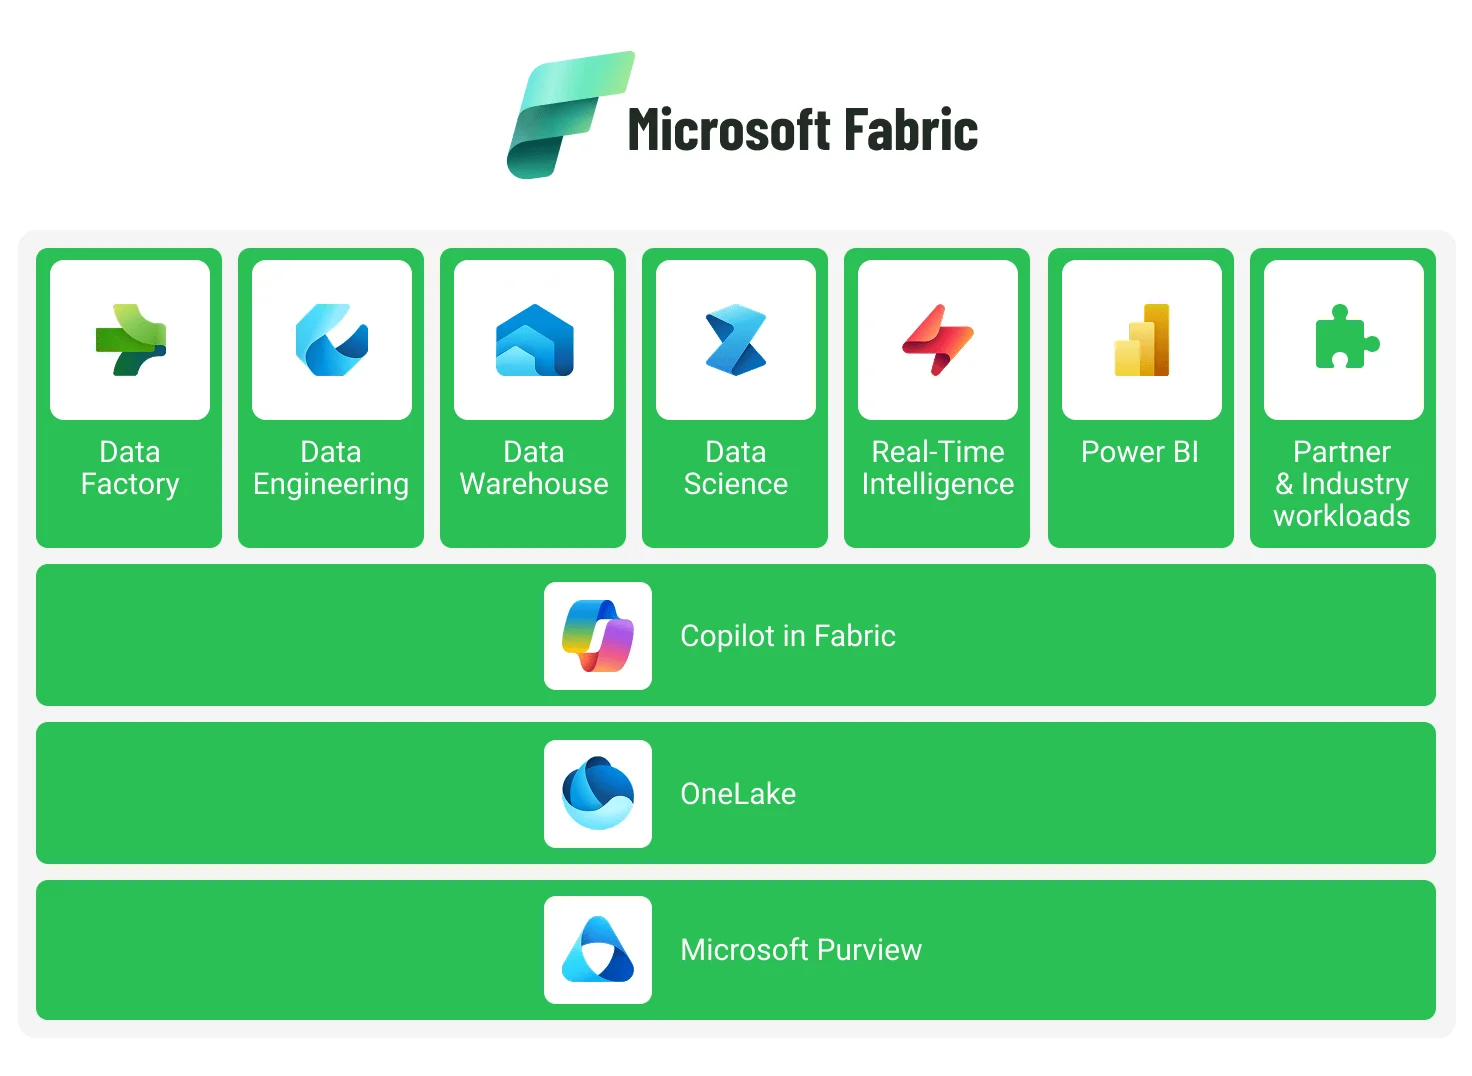
Exploring Fabric Workloads: One Platform, Infinite Possibilities
Microsoft Fabric’s strength lies not only in its unified storage and governance but also in its breadth of integrated workloads. Each workload targets a specific segment of the modern analytics lifecycle, yet all operate cohesively within the same SaaS environment and data foundation (OneLake).
Below, we provide an overview of the primary workloads that comprise the Fabric ecosystem.
Data Factory: simplifying data integration and orchestration
Fabric’s Data Factory modernizes data integration by combining traditional ETL/ELT pipelines with low-code and no-code authoring tools. Users can design complex workflows visually, connect to over 200 data sources, and leverage Dataflow Gen2 for transformation tasks.
Its integration with AI-assisted Copilot enables teams to generate pipeline code or transformations using natural language prompts, dramatically reducing the time required to onboard new data sources or automate repetitive processes.
Data Engineering: scalable processing with Spark and Lakehouses
The Data Engineering workload enables advanced data preparation and modeling at scale using Spark-based notebooks. These notebooks support multi-language collaboration (Python, SQL, R, Scala), helping engineers and data scientists to work within the same environment.
Fabric introduces the concept of Lakehouses — a fusion of data lake flexibility and warehouse performance. Lakehouses allow teams to build structured, queryable datasets on top of OneLake while maintaining the agility of unstructured data storage.
Data Warehouse: high-performance, capacity-based SQL analytics
The Data Warehouse workload represents Microsoft’s reimagined approach to traditional warehousing. Built on a distributed architecture that abstracts infrastructure management and scales within your purchased Fabric capacity.
Unlike on-prem or IaaS-based solutions, Fabric’s Data Warehouse does not require manual tuning, storage provisioning, or scaling adjustments. Compute and storage scale automatically according to workload demand, ensuring cost efficiency and operational simplicity.
Data Science: from experimentation to production with MLOps
Fabric’s Data Science environment integrates directly with OneLake and other Fabric workloads, enabling end-to-end machine learning operations (MLOps). Teams can experiment, train, and deploy models using popular frameworks like scikit-learn, PyTorch, or TensorFlow, all within a collaborative environment.
Seamless integration with Azure Machine Learning further extends capabilities for advanced experimentation, versioning, and model governance, ensuring that insights can be operationalized across the business.
Databases: unified, scalable data management within Fabric
The Databases workload in Microsoft Fabric delivers a modern approach to managing structured data, combining transactional efficiency with analytical scalability. Built to operate seamlessly within Fabric’s unified capacity model, it enables organizations to manage operational data and analytical queries simultaneously, without requiring complex infrastructure oversight.
Fabric Databases provide elastic scalability and automatic performance optimization, removing the need for manual provisioning or resource management. Compute and storage adjust dynamically to workload patterns, ensuring consistent performance and cost control.
With native T-SQL support, full integration with OneLake, and enterprise-grade security, Fabric Databases streamline how data is stored, queried, and shared across workloads, enabling a consistent, governed, and high-performing data foundation for modern applications.
Real-Time Intelligence (formerly Real-Time Analytics): instant insights from streaming data
The Real-Time Intelligence workload is designed to handle event-driven and time-series data from IoT devices, applications, or telemetry systems. It allows users to process high-velocity streams using Kusto Query Language (KQL), the same syntax used in Azure Data Explorer.
With built-in connectors and pre-aggregated data models, Fabric enables near-instant insights, empowering use cases such as anomaly detection, live dashboards, and operational monitoring.
Power BI: integrated business intelligence
At the presentation layer, Power BI serves as Fabric’s visualization and reporting powerhouse. As a fully integrated workload, it connects natively to all Fabric data sources, providing self-service analytics and interactive dashboards powered by the same OneLake data foundation.
With Copilot integration, Power BI users can now create visualizations, write DAX formulas, or summarize insights simply by describing their needs in natural language, bridging the gap between data literacy and everyday business decision-making.
AI Integration in Microsoft Fabric: Copilot as the New Data Partner
Artificial intelligence is becoming a core component that shapes how users interact with data. Within Microsoft Fabric, this intelligence is embodied in Copilot, the AI assistant that transforms how teams build, query, and visualize data.
Designed to work across all Fabric workloads, Copilot enhances productivity by turning natural language into data-driven actions, from generating code and optimizing data models to producing Power BI dashboards in seconds. What used to take hours of manual scripting, debugging, and report formatting now takes minutes.
Automating code generation and data preparation
For data engineers, Copilot simplifies one of the most time-consuming phases of analytics: data ingestion and transformation. In Data Factory, users can describe what they want, e.g., “connect to my sales data from SQL Server and clean duplicate rows,” and Copilot automatically generates a data pipeline with optimized logic and reusable code.
In Data Engineering notebooks, Copilot assists by writing PySpark, SQL, or Python code snippets for everyday operations such as joins, aggregations, or schema detection. This minimizes repetitive coding and lowers the barrier for less technical users to engage in data engineering tasks.
Example: Copilot in Fabric generated a complete data preparation pipeline with just a single prompt, reducing development time by over 40% compared to manual scripting workflows.
Simplifying DAX formulas in Power BI
Power BI’s Data Analysis Expressions (DAX) language is powerful but notoriously complex. Copilot transforms how DAX is written by allowing analysts to describe their intent in plain English.
For instance, instead of manually crafting a multi-layer DAX formula to calculate year-over-year growth, a user can type:
“Show me sales growth compared to the same month last year.”
Copilot then generates the correct DAX expression, validates it, and even explains the logic, helping users learn while they work.
This AI-driven approach reduces errors, speeds up report creation, and makes advanced analytics more accessible to business users without deep coding knowledge.
Governance, Cost Efficiency, and Collaboration in Microsoft Fabric
Beyond performance and innovation, the actual value of Microsoft Fabric lies in its ability to balance cost optimization, security, and collaboration. These three pillars define the long-term sustainability of any analytics platform.
Lower Total Cost of Ownership (TCO)
Fabric’s unified SaaS model drastically simplifies cost management compared to traditional multi-tool analytics ecosystems. Organizations no longer need to maintain separate infrastructures for ETL, warehousing, and BI: everything runs on a single capacity-based pricing structure.
Fabric uses hourly capacity billing. Teams can scale or pause capacity to align spending with demand, thereby reducing the total cost of ownership.
Built-in security and governance with Microsoft Purview
Fabric integrates natively with Microsoft Purview, enabling end-to-end governance across all data assets, from ingestion to reporting. This means organizations can automatically apply policies, monitor lineage, and control access across every dataset stored in OneLake.
Key benefits include:
- Unified data cataloging: Purview automatically discovers and classifies data across Fabric workloads.
- Consistent compliance: Integration with Microsoft Entra ID (formerly Azure Active Directory) ensures secure, role-based access control.
- End-to-end lineage visualization: Teams can trace every transformation from raw data to the final dashboard, meeting regulatory requirements like GDPR or HIPAA.
By embedding Purview at the platform level, Microsoft ensures that governance is a native layer of trust and accountability.
Boosting collaboration across data roles
Fabric’s shared data foundation (OneLake) and unified UX break down the long-standing silos between engineers, analysts, and scientists. Since all workloads run within the same environment and reference the same datasets, collaboration becomes seamless and transparent.
- Data engineers can prepare data once, and analysts can visualize it immediately in Power BI.
- Data scientists can build models directly on governed datasets without waiting for extraction or approval processes.
- Business users can independently explore insights while maintaining security and compliance.
This cross-functional approach accelerates time-to-insight, improves communication between technical and business units, and fosters a data-driven culture within organizations.
Conclusion: The Next Step in Unified Analytics
Microsoft Fabric represents a significant shift in how enterprises approach data, from fragmented systems to a truly unified analytics experience. With OneLake as the central hub, Copilot as an AI enabler, and Purview as a governance backbone, Fabric brings together the full data lifecycle within one cohesive platform.
For organizations struggling with data silos, inconsistent governance, or rising infrastructure costs, Fabric provides a clear path toward simplification, scalability, and innovation.
Emerline, as an experienced Microsoft solutions partner and an active member of the Microsoft Fabric Partner Community, helps companies navigate this journey, guiding them from assessment to full-scale Fabric adoption.
Now is the time to explore how Microsoft Fabric can transform your data strategy. Contact our experts to discuss your analytics goals or request a personalized consultation.
Published on Oct 23, 2025