Power BI vs. Excel: Choosing the Right Tool for Data Analysis
In an era of rapidly growing data volumes, efficient information collection, analysis, and interpretation are crucial for any business's development. Business Intelligence (BI) is central to this process, enabling organizations to transform raw data into actionable insights that inform strategic and operational decisions, optimize processes, identify new market opportunities, and sharpen competitive advantages. Without the right BI tools, even the most extensive datasets remain dormant assets, unable to generate real value.
For decades, Microsoft Excel has been a ubiquitous spreadsheet tool, serving as a foundation for organizing, calculating, and performing basic data analysis across all industries and levels. Its widespread familiarity has made it the "Swiss Army knife" of the business world. However, as data volumes grow exponentially and the demand for interactive, real-time data increases, a more specialized solution has emerged from the Microsoft ecosystem: Power BI. Initially built on Excel add-ins like Power Query, Power Pivot, and Power View, Power BI has evolved into a dedicated business intelligence platform designed to handle the complexities of modern data analysis at scale.
This article offers an in-depth comparison of Microsoft Power BI and Excel, two powerful tools from Microsoft that, despite their shared origins, cater to different data analysis needs and scales. The choice between them is not merely a technical decision; it's a strategic move determining how an organization leverages data, adapts to change, and competes in the long run. This analysis will evaluate key aspects such as data handling, visualization capabilities, modeling, security, collaboration, integration, pricing, and more. It will enable business leaders, IT managers, and analysts to select the solution that best aligns with their needs and future vision.
Microsoft Excel
Microsoft Excel has been a cornerstone of data management and analysis for decades. Its grid-based interface is universally recognizable, making it incredibly accessible to users of all skill levels, from homemakers tracking purchases to global enterprises monitoring project progress. This ubiquity significantly lowers the barrier to entry for basic data tasks and quick calculations. Excel's global user base is estimated to be between 1 and 1.5 billion people, making it an integral part of individual workflows and various business functions.
Using Excel in business
| Process | Functionality |
| Structuring and extracting business information | Tables, Filters, Data Validation, Customer, Sales, Operations Accounting |
| Financial calculations and budgeting | Formulas (SUMIF, VLOOKUP), Financial reports, Revenue forecasting, Profitability analysis |
| Sales and inventory management | Inventory level calculation, Reorder point determination, Sales growth trend analysis |
| Automating repetitive tasks (macros/VBA) | Payroll calculations, Expense reports, Task planning, Productivity improvement |
Among Excel's key features for data analysis are:
- Formulas and functions: Excel boasts an extensive library of functions, enabling a wide range of calculations, from simple arithmetic to complex statistical analysis. This flexibility makes it ideal for ad-hoc analysis and creating highly customizable reports.
- PivotTables: A cornerstone of Excel's analytical capabilities, Pivot Tables allow users to summarize, analyze, explore, and present summarized data from large datasets. They are highly effective for identifying trends and patterns in structured data.
- Charts and data visualization: Excel offers various chart types, including line, column, pie, area, and more advanced options like treemaps, sunbursts, histograms, and waterfall charts. These tools help users present information and transform raw data into meaningful visuals for decision-making. While Excel's visualizations tend to be more static than Power BI's dynamic interactivity, they are customizable regarding colors, labels, and axes. The "Analyze Data" feature (formerly "Ideas in Excel") for Microsoft 365 subscribers allows users to ask questions about their data in natural language without complex formulas, providing visual summaries, trends, and patterns.
- The role of Power Query and Power Pivot add-ins: Excel's capabilities for handling large datasets and complex data modeling have been significantly enhanced by built-in features such as Power Query and Power Pivot.
– Power Query: This tool enables users to connect to various data sources, perform complex data cleaning and transformation tasks (ETL), and process millions of rows of data, making it indispensable for advanced data analysis within Excel.
– Power Pivot: A data modeling technology that allows users to import millions of rows from multiple sources into a single Excel workbook, create relationships between disparate data, and perform fast calculations using DAX (Data Analysis Expressions). It enables the creation of complex data models within Excel, extending its analytical power beyond traditional spreadsheet limitations. However, it's worth noting that while these add-ins extend Excel's capabilities, they also require a steeper learning curve (especially DAX) and are not available for Mac.
Excel's ubiquity and familiarity are its greatest strengths, ensuring rapid adoption and immediate utility for basic tasks. However, this very ubiquity can become a limitation. Because many users are already accustomed to Excel, organizations often default to it even for functions for which it is suboptimal, leading to inefficient processes and situations where users struggle with more complex calculations. This creates a dependency that can hinder the adoption of more specialized, powerful tools like Power BI, even when they’re a better fit for the task. The "Analyze Data" feature represents Microsoft's attempt to bridge this gap by bringing BI-like capabilities into the familiar Excel environment, but it still operates within Excel's fundamental limitations.
While Excel is often perceived as a basic spreadsheet tool, the presence of Power Query and Power Pivot fundamentally changes its capabilities. These add-ins, the foundation of Power BI, enable Excel to handle "millions of rows of data" and perform "complex data transformations". This means that a skilled Excel user, leveraging these tools, can achieve a level of data analysis comparable to basic business intelligence.
However, the fact that these are add-ins and that DAX requires a "steep learning curve" points to a fragmentation of functionality and a higher barrier to entry for advanced use within Excel itself, pushing users towards a dedicated platform like Power BI for a more integrated and scalable experience. This highlights the interconnectedness between advanced Excel and Power BI as a "stepping stone".
Microsoft Power BI
Microsoft Power BI is an interactive data visualization software primarily focused on business intelligence. It is designed to transform raw data from various sources into static and interactive visualizations, providing actionable insights. Unlike Excel, a general-purpose spreadsheet, Power BI is specifically engineered for enterprise-level analysis and reporting.
Among Power BI's key features are:
- Interactive data visualization and dashboards: Power BI's strength is creating dynamic and interactive visualizations and dashboards. Users can filter, sort, and drill down into visuals to explore data from different angles, providing up-to-date analytics and dashboards. It offers a broader selection of visuals than Excel, including custom visuals from AppSource, and AI-powered visualizations such as Q&A and Decomposition Tree.
- Diverse data connectivity: Power BI can connect to a wide range of data sources, including databases, web pages, PDFs, structured files (spreadsheets, CSV, XML, JSON), SharePoint, cloud services (e.g., Azure SQL Database, Google Analytics, Salesforce), and on-premise data sources. This flexibility allows for the integration of disparate datasets for comprehensive analysis. Features like Dataflows and DirectQuery enable access to real-time data without importing it, which is crucial for dynamic reporting.
- Advanced data transformation (Power Query Editor) and modeling (DAX): Power BI integrates the Power Query Editor for powerful data cleansing and transformation, offering a graphical interface for complex data preparation without writing SQL code. It uses DAX (Data Analysis Expressions) for data manipulation and complex calculations, which is a powerful language for creating measures and calculated columns within the data model.
- AI capabilities: Power BI actively leverages artificial intelligence capabilities, allowing users to gain insights through advanced data analysis tools, instantly create reports, and get answers to conversational queries with features like Copilot.
One of Power BI's most significant advantages is its deep integration with the broader Microsoft ecosystem, including Microsoft 365, Azure, and Dynamics 365. This integration ensures a seamless user experience and significantly lowers adoption barriers for companies already actively using Microsoft products, facilitating faster implementation and reduced training costs. The centralized OneLake hub further contributes to a single source of truth for data, enabling analytical capabilities to scale to thousands of users.
Power BI's core features, particularly its interactive dashboards, real-time data capabilities, and centralized sharing, shift the paradigm from static, analyst-generated reports to a self-service BI model. This means that a few individuals don’t just consume data but the data can be explored and drilled into by a wider audience across the organization. The ability to access data on mobile devices further expands this democratization. This shift empowers more users to make data-driven decisions without constant reliance on data analysts, freeing up analysts for more complex, ad-hoc work. It fosters a truly data-driven culture as data becomes easily accessible and explorable, leading to faster and more informed decisions at all levels of the business.
Power BI's deep integration with the Microsoft ecosystem (Microsoft 365, Azure, Dynamics 365) is repeatedly highlighted as a key advantage. This is not just a convenience; it's a strategic move. For organizations heavily invested in Microsoft products, this integration reduces training costs (users are familiar with the interface), speeds implementation, and streamlines security and governance. This integration creates powerful synergy, making Power BI an obvious choice for many businesses. However, it also implies potential "vendor lock-in", which can be a strategic limitation for organizations pursuing multi-cloud or vendor-agnostic strategies in the long term. The strategic decision extends beyond a BI tool and encompasses the entire IT ecosystem.
Comparison: Power BI vs. Excel for Data Analysis
The choice between Microsoft Power BI and Excel for data analysis depends on many factors, including data volume, required level of interactivity, collaboration needs, security considerations, and the organization's overall data strategy. The following table briefly overviews the key differences between the two platforms, followed by a detailed discussion of each aspect.
Table: Power BI vs. Excel: Key Aspects for Data Analysis
| Characteristic | Microsoft Excel | Microsoft Power BI |
| Interface | Familiar, with cells and tables. | Modern, visual, supports drag-and-drop. |
| Data Handling | Limited to ~1 million rows, slow with large data. | Supports millions of rows, optimized for large volumes. |
| Modeling and Transformation | Has Power Query and Power Pivot, but requires setup. | Built-in Power Query Editor, strong modeling and DAX support. |
| Visualization | Static charts, limited interactivity. | Dynamic, interactive reports and dashboards, AI visualizations. |
| Learning Curve | Easy to start, difficult to deep dive (e.g., DAX, VBA). | Requires learning, especially DAX, but abundant online resources. |
| Collaboration | Co-editing via OneDrive; version control limited. | Centralized publishing, automatic updates, MS Teams integration. |
| Security | Password protection, but limited capabilities. | Granular row-level security, Azure AD integration. |
| Integration | Integrates with Office and SharePoint. | Deep integration with Microsoft 365, Azure, and other services. |
| Cost | Included in Microsoft 365, but requires much manual work. | Power BI Desktop - free; Pro and Premium - paid, but cost-effective at scale. |
| Automation | Flexible, but much is done manually. |
Automation-focused, operates on a "set it and forget it" principle. |
Data handling and scalability
Excel is traditionally limited to 1,048,576 rows and 16,384 columns per sheet. While newer versions can handle larger datasets using Power Query and Power Pivot, performance can significantly slow down or become sluggish when working with large spreadsheets, especially with complex formulas or functions. Excel struggles to scale for enterprise-level data analysis.
- Example: An analyst exports CRM data for 1.5 million customers. Excel doesn't load all the data, requiring it to be split into multiple files, which leads to errors and slows down analysis.
Power BI, in contrast, is designed to handle millions of rows and large datasets efficiently. Power BI Desktop datasets are typically limited to 1 GB, but Power BI Premium capacity allows for much larger models. It employs powerful compression algorithms to import and cache massive amounts of data, enabling detailed information and summaries to be retained in a single file. Power BI is better suited for high-volume workloads with high data variability, making it suitable for cross-departmental analytics or real-time data acquisition at an enterprise scale.
- Use case: A bank uses Power BI to build a real-time customer transaction dashboard. Twenty million rows are processed without delays.
Excel's fundamental row limit is critical. When organizations exceed this limit, they resort to manual workarounds, such as splitting data across multiple sheets or files. This immediately leads to operational inefficiencies, increases the risk of data fragmentation and inconsistencies, and makes aggregated reporting cumbersome and time-consuming. When working with large datasets, performance degradation further exacerbates these issues, making data analysis frustrating and slow. Thus, Excel's "million-row wall" is not just a technical limitation; it is a critical operational bottleneck that can seriously impede an organization's ability to gain comprehensive data, maintain data integrity, and scale its analytical capabilities. It forces a reactive, fragmented approach to data rather than a proactive, unified one.
Data modeling and transformation
Excel's basic data modeling capabilities allow users to create simple models and establish relationships between different datasets. While Power Query is integrated for data cleaning and transformation, offering a graphical interface for complex data preparation, and Power Pivot allows for advanced data modeling using DAX, they are often viewed as add-ins or separate features within Excel rather than a core, integrated BI workflow. DAX, while powerful, can have a steep learning curve.
- Example: A financial analyst manually sets up relationships between three tables and uses VLOOKUP to combine data, causing errors and complex formulas.
Power BI integrates ETL functionality directly into the tool through its Power Query Editor, making it accessible to business users. This streamlines end-to-end workflows and reduces reliance on separate tools or specialized roles. It uses DAX for complex calculations, offering robust data manipulation capabilities in a high-performance environment. Power BI's design focuses on seamless switching between data modeling, report building, and data transformation tasks.
- Use case: A retailer loads sales, customer, and inventory data and combines them into a single model. All transformations are done in Power Query, and metrics are calculated via reusable DAX measures.
Excel's internal design is cell-centric, where calculations are often tied to specific cell references, offering immense flexibility for individual, ad-hoc calculations. This can lead to complex, difficult-to-maintain formulas and a lack of structured data models. Power BI, in contrast, is model-centric, relying on robust data models built with Power Query and DAX. While DAX has a steeper learning curve, it allows for consistent, reusable measures and calculations across the entire dataset, regardless of cell location. This fundamental difference determines the scalability and reliability of the analysis. Excel's flexibility can disadvantage complex enterprise-level reporting, leading to unintended errors or accidental data manipulations. Power BI's model-centric approach, while less flexible for ad-hoc cell-level customization, ensures data integrity, consistency, and automation for repetitive data, making it more reliable for strategic decision-making.
Data visualization and interactivity
Excel offers various chart types (line, column, pie, treemap, waterfall, etc.). Users can easily create and customize these charts with colors, labels, and axes. However, Excel's visualizations are more static and suitable for direct data presentation, and they lack Power BI's dynamic, interactive features. While it offers some interactive options like slicers, they are not as dynamic or flexible as in Power BI.
- Example: A marketing manager creates a line chart of sales growth, but when the region changes, the chart has to be rebuilt manually.
Power BI excels in its wide variety of advanced, highly customizable, and interactive visualizations. It allows for data drilling, cross-filtering, and more flexible interaction with charts, tables, and visuals. Power BI is recognized as a leader in "visual storytelling," transforming complex information into a cohesive narrative that even non-data specialists can understand. It offers a specialized marketplace (AppSource) for custom visuals and uses AI for data retrieval.
- Use case: A strategic dashboard allows the sales director to click on a region and instantly see KPI trends by product, representative, and month.
Excel's charting capabilities are strong for displaying data points and trends. However, interactivity is limited, often requiring manual filtering or static slicers. Power BI, in contrast, emphasizes "visual storytelling", where dashboards are highly interactive, allowing users to explore data from various angles through drilling and cross-filtering dynamically. This transforms data from a mere presentation into an engaging narrative.
This distinction is crucial for how data is consumed and utilized. Static Excel charts often require the analyst to explain the "story," whereas Power BI empowers the audience to discover insights independently through interaction. For client presentations, marketing campaigns, or strategic reports to senior management, Power BI's superior visual impact and interactivity directly influence decision-making and the perceived value of the presented data.
User interface and learning curve
Excel's interface is familiar to billions of users, making it highly accessible, especially for those new to data analysis or lacking technical expertise. Its intuitive grid simplifies data entry and manipulation. The learning curve for basic functions is smooth and fast for most beginners.
- Example: An accountant without BI skills manually builds Excel reports using SUMIF and PivotTables.
While using a drag-and-drop interface, Power BI has a steeper learning curve than Excel, especially for advanced analytics, custom visualizations, and mastering DAX. It requires a mindset different from Excel, particularly for understanding concepts like row/filter context in DAX. However, the depth and breadth of analysis offered are significant for those willing to invest time in learning.
- Use case: A team of BI engineers undergoes Power BI training and creates standardized reports that automatically update and require no manual intervention.
Excel's low learning curve and widespread familiarity make it easy to learn, leading to quick initial adoption. This can create a "familiarity trap" where organizations default to Excel even when its limitations become apparent, due to an unwillingness to learn a new, more complex tool. While more complicated to understand, Power BI offers significantly deeper analytical capabilities. Investing in staff training for Power BI, although higher, can unlock far greater analytical power and automation, leading to a lower total cost of ownership (TCO) in the long run by reducing manual labor and improving decision quality. The choice reflects a trade-off between immediate ease of use and long-term analytical maturity and efficiency.
Collaboration and data sharing
Excel supports co-authoring when files are stored in shared locations like OneDrive or SharePoint, allowing multiple people to work on the same workbook simultaneously. Changes are synchronized when online, with conflict warnings. Sharing is typically done by emailing large files or placing them on shared drives. However, this can lead to version control issues and security risks.
- Example: Three analysts edit the same KPI table in turns, eventually losing changes and creating duplicate files.
Power BI significantly simplifies sharing reports and dashboards through cloud options, email, and embedding in various applications. It offers practical, real-time collaboration features due to its deep integration with Microsoft Teams. Teams gain access to a centralized cloud dashboard, ensuring everyone sees the same data with role-based security. Power BI Service also allows for easy data sharing with a PRO license. Automatic data refresh ensures reports are always up-to-date, reducing time spent on repetitive tasks.
- Use case: The sales team accesses a dashboard in Power BI Service daily, where they see their real-time metrics without opening Excel files.
Collaboration in Excel, while allowing co-authoring, is essentially file sharing. This inevitably leads to issues such as version control problems, data silos ("Excel files can circulate within the company, on various drives and in emails" ), and manual refresh cycles. Power BI, in contrast, is built on a centralized cloud service where users access a single, continuously updated source of truth. This difference is crucial for operational efficiency and data integrity. Power BI automates data distribution, reduces manual labor, eliminates version confusion, and provides real-time data. This allows sales departments to get real-time data instead of waiting for daily Excel reports, reducing meeting preparation time and accelerating decision-making. This transforms collaboration from a logistical problem into a seamless, unified process for organizations.
Security and data governance
Excel offers basic security features such as password protection for workbooks, sheets, and individual cells. It can restrict opening, modifying, or provide read-only access. However, it lacks granular control over who can see specific data within files and a comprehensive, centralized approach to data security. Core data can still be exposed.
- Example: An Excel file with employee salaries is accidentally sent to everyone, and there's no way to restrict the viewing of individual rows.
Power BI is built to provide comprehensive and robust data protection, having received high security classifications. It offers Row-Level Security (RLS), allowing data access to be restricted for specific users, ensuring they only see relevant information. It uses Azure Active Directory for authentication and the TLS protocol for secure communication. It provides comprehensive access control, data governance, and auditing capabilities, including multi-factor authentication and role-based access control. Power BI is integrated with Microsoft Purview Information Protection for classification, labeling, auditing, and compliance.
- Use case: In an HR dashboard, employees see only their performance data, while managers see their teams' metrics thanks to an RLS setup.
Excel's security features primarily aim to protect the file (password to open/modify, workbook encryption, sheet/cell protection). This is static, document-level security. Power BI, on the other hand, offers data-level security through RLS and integrates deeply with enterprise identity and access management systems like Azure Active Directory. This means control over who sees what data within a report, not just who can open the file. This distinction is paramount for regulatory compliance (e.g., GDPR, CCPA), especially in regulated industries like finance or healthcare. Excel's approach is insufficient for ensuring that sensitive data is only visible to authorized individuals within a shared report. Power BI's robust, centralized data governance capabilities eliminate the risk of unauthorized data disclosure and ensure a "single source of truth" where all users interact with consistent, controlled data regardless of their access level. This significantly reduces risks and enhances data trust.
Integration and ecosystem
While Excel is part of the Microsoft Office suite, it primarily functions as a standalone application for data analysis. It can integrate with other Microsoft 365 applications for file sharing (OneDrive, SharePoint) and uses Power Query/Power Pivot, also present in Power BI.
- Example: An analyst manually copies a table from Excel to PowerPoint before each presentation.
Power BI boasts deep and seamless integration with the broader Microsoft ecosystem, including Microsoft 365, Azure, and Dynamics 365. This integration provides a unified user experience and significantly lowers adoption barriers for companies actively using Microsoft products. It leverages cloud infrastructure and Azure services for optimal performance and scalability.
- Use case: An automated sales performance report in Dynamics 365 updates and displays in Power BI, accessible via Microsoft Teams to all relevant departments.
The choice between Power BI and Excel often depends on the organization's technology stack. For companies deeply integrated into the Microsoft ecosystem (Microsoft 365, Azure, Dynamics 365), Power BI offers a natural, seamless extension. This is not just convenience; it means leveraging existing licenses, reducing integration complexity, and minimizing training for users familiar with Microsoft interfaces. Excel, while also a Microsoft product, operates more as a standalone application for data analysis, even with its add-ins. Power BI's deep integration can accelerate BI adoption and reduce overall TCO for Microsoft-centric organizations by leveraging their prior investments and familiarity. However, it also implies a greater degree of vendor lock-in, which can be a strategic consideration for organizations pursuing multi-cloud or vendor-agnostic IT strategies.
Cost and Total Cost of Ownership (TCO)
Excel is often perceived as "free" or inexpensive because it is typically included in Microsoft 365 subscriptions, which are widely prevalent in business. Microsoft 365 Personal costs around $9.99 per month, while Family costs around $12.99 per month. Direct licensing costs for Excel alone are minimal if it's already part of a suite.
- Example: The financial team manually updates reports 8 hours a week, costing the company $10,000 annually.
Power BI generally offers a more cost-effective solution for specialized business intelligence. Power BI Desktop is free. Power BI Pro costs less than $10 per month per user, and Power BI Premium Per User costs $20. Premium capacity for large organizations costs $4995 per month. While Tableau is more expensive, Power BI is more budget-friendly than other specialized BI tools.
- Use case: A manufacturing company implemented Power BI and reduced report preparation time from 5 hours to 15 minutes, recouping the subscription cost in the first month.
While Excel's direct licensing costs may seem lower (often bundled with M365), the Total Cost of Ownership (TCO) extends far beyond licensing fees, including training, integration, and maintenance. Excel's limitations with large datasets, lack of automation, and collaboration and security issues often lead to significant hidden costs: increased manual labor, time spent on data reconciliation and version control, and potential losses from inaccurate or delayed data. Despite its subscription fees, Power BI can lead to a lower TCO for organizations with growing data needs due to its automation capabilities, scalability, and robust governance features. The decision should be based on initial licensing costs and a comprehensive assessment of operational efficiency, risk reduction, and the value gained from faster, more reliable data. A "cheap" tool can prove more expensive if it hinders productivity and decision-making.
Automation vs. flexibility
Excel offers excellent flexibility for creating customizable reports and dashboards, allowing users to tailor spreadsheets to specific needs and use cases. It excels in ad hoc analysis and scenarios requiring extensive use of formulas and custom calculations. However, this flexibility often comes at the expense of automation, as reports frequently require manual updates.
- Example: An analyst manually changes a credit risk scoring model before each monthly review.
Power BI is focused on automation and scalability, excelling at standardizing and automating data reporting. Its scheduled refresh feature enables seamless automatic data refresh. Power BI's goal is "set it and forget it" for recurring reporting. While it is less flexible for highly customizable, cell-level ad-hoc analysis than Excel, it offers a high degree of automation.
- Use case: The business KPI report automatically updates every hour; management doesn't need to request current data — it's always at hand.
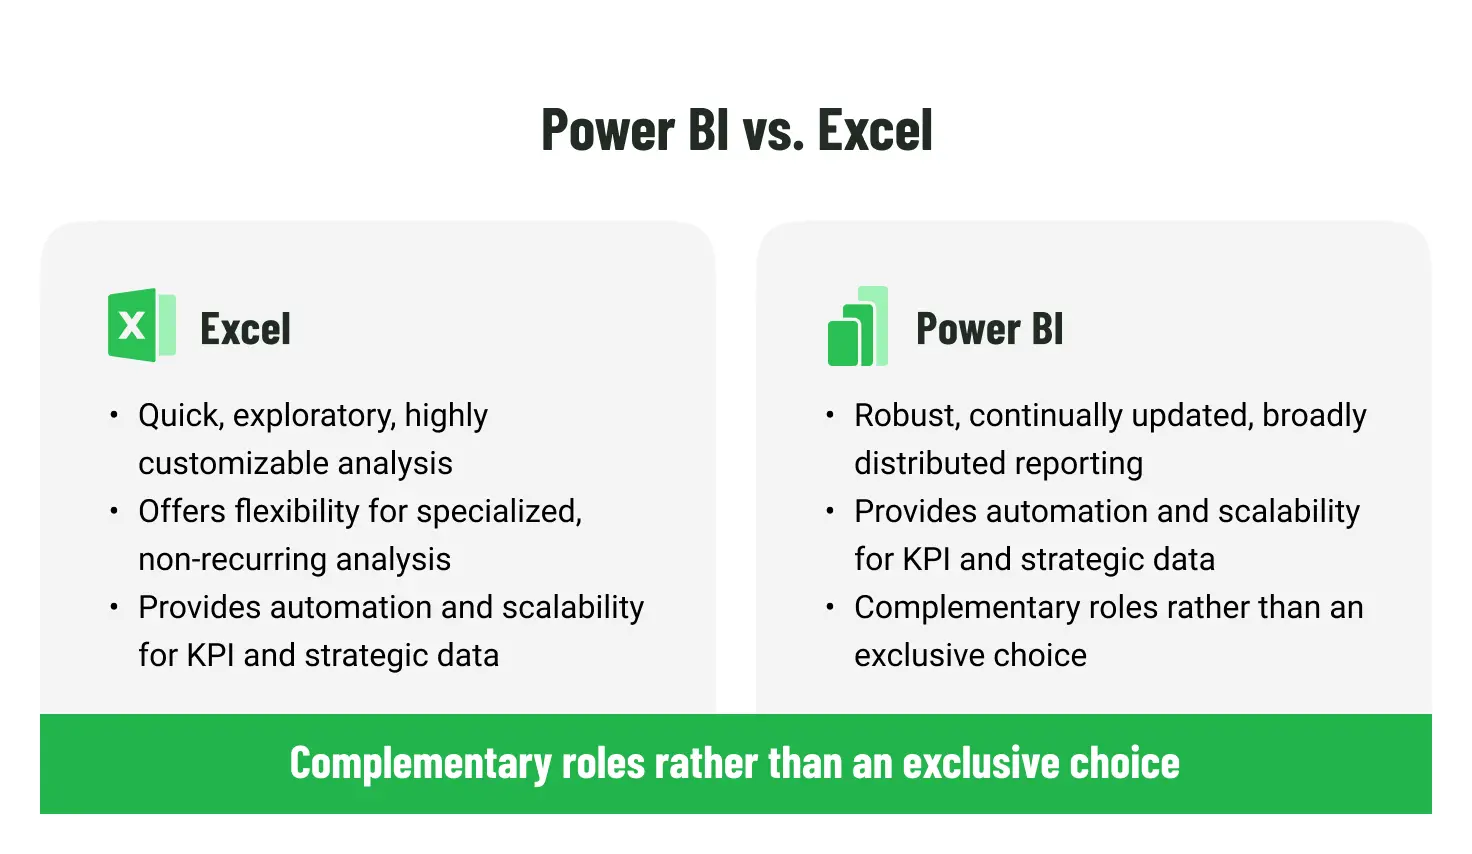
This comparison highlights a fundamental philosophical difference. Excel is like an artisan's workshop: highly flexible, capable of crafting unique, custom-designed analyses for specific, often one-time needs. This requires manual labor for each new creation or update. Power BI, in contrast, is like a well-oiled production line: designed for automation, standardization, and repetitive output. It sacrifices some of that "bespoke" flexibility for efficiency and scalability. The choice here depends on the nature of the analytical request. Excel's flexibility excels if a quick, exploratory, and highly customizable ad-hoc analysis that won't be repeated frequently is needed. If the goal is to create a robust, continually updated, and widely distributed reporting system for KPIs and strategic data, Power BI's automation and scalability are invaluable. Organizations often need both, indicating a complementary relationship rather than an exclusive choice.
Excel vs. Power BI: When Each Shines
Power BI and Excel should be a strategic decision based on an organization's needs, data volume, interactivity and collaboration requirements, and overall technology landscape.
Ideal scenarios for Excel
- Small-scale, ad-hoc analysis: Excel is perfect for quick, one-off data explorations, simple calculations, and personal data management when the dataset is small (thousands of rows).
- Financial modeling and budgeting: Excel's robust formula capabilities make it a primary tool for complex financial models, payment schedules, budgeting, and scenario analysis. Replicating typical Excel financial models in Power BI can be challenging.
- Data entry and basic organization: Excel's grid layout and data validation features are highly effective for maintaining lists of customer contacts, sales records, employee performance metrics, or supply details.
- Quick calculations and simple reporting: These are ideal for internal operational reporting where accuracy and repeatability are valued over advanced aesthetics. They are also helpful when quick answers, simple summaries, or basic charts are needed without complex interactivity.
- Situations valuing flexibility and familiarity: This is for users with strong Excel skills who need to piece together data quickly without much regard for structure and solve problems rapidly. It is the "Swiss Army knife" of the business world.
Ideal scenarios for Power BI
- Large datasets and Big Data analytics: Power BI's ability to handle massive data volumes without performance degradation is crucial when dealing with millions of rows or data expected to grow rapidly.
- Enterprise-level reporting and dashboards: For creating interactive, dynamic dashboards and reports that provide a holistic view of company performance across departments. It is ideal for enterprise-level business intelligence solutions.
- Real-time data and automated reporting: When up-to-date data and automatic data refresh are required for key performance indicators, sales metrics, or customer service metrics.
- Collaborative environments and centralized data: For teams needing access to a centralized cloud dashboard, ensuring everyone sees the same data with role-based security and seamless sharing via Microsoft Teams.
- Strategic decision-making and visual storytelling: When the visual presentation of data is as strategically significant as the data itself, such as for client reports, marketing campaigns, or senior management presentations. Power BI excels at transforming data into compelling narratives.
- Deep integration with Microsoft stack: The natural choice for companies already actively using Microsoft 365, Azure, and Dynamics 365, leveraging seamless integration and familiar interfaces.
Hybrid approaches
- Complementary strengths: A single platform may not suffice in many complex enterprise scenarios. Excel and Power BI can form a harmonious partnership, each playing its distinct role. For instance, a finance department might use Excel for precise, detailed financial modeling and ad-hoc analysis. In contrast, a marketing department uses Power BI for real-time campaign analytics and interactive client dashboards.
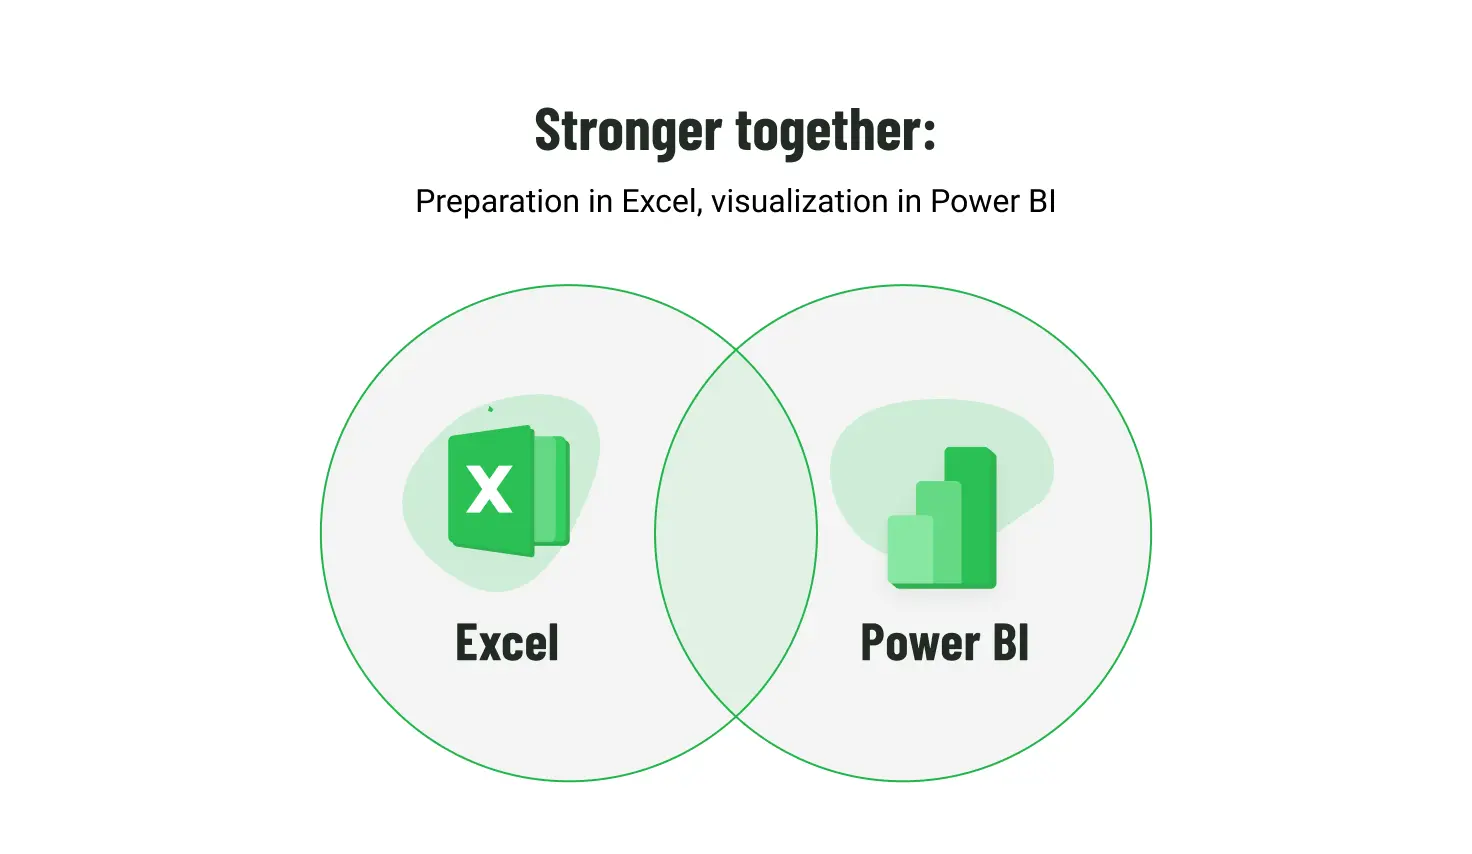
- Data preparation in Excel and visualization in Power BI: Users can leverage Power Query and Power Pivot in Excel for initial data cleansing and modeling, then seamlessly import these prepared data models into Power BI for advanced visualization and sharing. This can be a good stepping stone to Power BI adoption.
- Unified data platforms: For enterprises with a comprehensive technological environment (on-premises databases, cloud applications like Snowflake and Salesforce) and diverse needs across different departments, the solution may lie in implementing a flexible, modern platform capable of unifying data from various tools, departments, and sources without the need for compromises.
Conclusion
The choice between Microsoft Power BI and Excel is not a matter of which tool is "better" in an absolute sense, but which tool optimally aligns with an organization's unique needs, existing infrastructure, budget, and strategic goals. Both powerful data analysis solutions offer robust functionality but have different emphases and philosophies.
Excel remains an indispensable tool for individual use, detailed data manipulation, financial analysis, and small, ad-hoc datasets, offering unparalleled flexibility and familiarity. Power BI, in contrast, excels at creating interactive dashboards, handling large datasets, providing enterprise-level business intelligence solutions, and facilitating real-time collaboration. They complement each other: Excel provides granular control and ad-hoc flexibility, while Power BI offers the scalability, automation, and visual impact needed for strategic decision-making across the organization.
Regardless of the chosen tool or combination, successful BI implementation requires strategic planning, a deep understanding of business processes, and a skilled team. Organizations should evaluate their data volume, analytical capabilities, desired level of flexibility versus automation, and existing technology stack. Investing in the right tools and necessary training will empower teams to transform raw data into valuable, actionable insights, fostering sustainable business growth and a competitive advantage.
How Emerline can help
Emerline offers a complete cycle of BI services, from auditing current solutions and implementing Power BI to customizing reporting, integrating existing systems, and scaling analytical platforms. Our team of experts will help:
- Assess your organization's BI maturity.
- Build a data architecture that combines Excel, Power BI, and other sources.
- Set up automated reporting and KPI dashboards.
- Provide user training and support.
- Integrate Power BI into the Microsoft 365, Azure, and other platform ecosystems.
We will help turn your data into a competitive advantage. Contact us to discuss how to make your analytics a strategic asset.
Published on Jul 1, 2025