Excel, SharePoint, and Power BI Integration: Enterprise Architecture, Automation, and Implementation Guide
Table of contents
- Quick Answer: How Excel, SharePoint, and Power BI Work Together
- Key takeaways
- When Should Enterprises Integrate Excel, SharePoint, and Power BI?
- Analytical Scale and Solution Alignment Matrix
- Why Excel-Based Reporting Fails at Enterprise Scale
- 1. The proliferation of spreadsheet data silos
- 2. Manual reporting and consolidation drag
- 3. Lack of systemic data governance
- How SharePoint Extends Excel for Enterprise Data Management
- SharePoint as a governed document repository
- SharePoint lists as structured data sources
- Power BI SharePoint Integration Architecture
- Excel vs. SharePoint vs. Power BI: Functional Comparison
- Step-by-Step: How to Connect Excel and SharePoint to Power BI
- Step 1: Standardize and store data in Microsoft 365 cloud library
- Step 2: Connect Power BI desktop using native web APIs
- Step 3: Clean and transform data in Power Query
- Step 4: Build a governed semantic model
- Step 5: Publish and schedule cloud refreshes
- Enterprise Architecture: Excel + SharePoint + Power BI
- Architectural flow breakdown
- 1. Ingestion layer
- 2. Intermediate ETL layer (Dataflows)
- 3. Semantic layer (Unified Datasets)
- 4. Visualization and consumption layer
- When Excel and SharePoint Are Not Enough: Moving Toward Microsoft Fabric
- Business Benefits of Excel + SharePoint + Power BI Integration
- Implementation Challenges and How to Mitigate Them
- Challenge 1: Unstructured data inside Excel workbooks
- Challenge 2: API throttling under heavy query loads
- Challenge 3: Inconsistent data ownership and lifecycles
- Challenge 4: Insecure access control over sensitive datasets
- Excel and SharePoint to Power BI Migration Roadmap
- Phase 1: Portfolio assessment and discovery
- Phase 2: Target architecture and schema design
- Phase 3: Data cleansing and pipeline deployment
- Phase 4: Semantic modeling and dashboard development
- Phase 5: Training, optimization, and governance
- How Long Does Excel SharePoint Power BI Integration Take?
- Typical Modernization Timelines
- Enterprise Use Cases
- 1. Corporate financial forecasting and variance analysis
- 2. Multi-departmental project management and milestone tracking
- 3. Regional sales pipelines and performance tracking
- Why Choose Emerline for Power BI and Microsoft 365 Analytics Solutions
- Frequently Asked Questions
Organizations worldwide rely on Microsoft Excel and SharePoint to manage operational data, financial models, project milestones, and critical business processes. However, as companies scale, relying solely on spreadsheet-based reporting introduces structural inefficiencies: disconnected data silos, manual copy-paste consolidation, inconsistent calculations, and a lack of historical version control.
This architectural bottleneck is not caused by user error; it is an inherent limitation of file-centric data storage. Enterprise business intelligence demands a system-enforced model where data collection, storage, transformation, and visualization operate as a single, governed pipeline.
By integrating Excel, SharePoint, and Power BI, organizations can leverage their existing Microsoft 365 investments to build automated, secure, and highly scalable analytics solutions. This comprehensive guide outlines the architecture, integration mechanics, migration roadmaps, and governance frameworks required to transform decentralized files into enterprise-grade business intelligence.
Quick Answer: How Excel, SharePoint, and Power BI Work Together
Excel, SharePoint, and Power BI integrate by utilizing Excel workbooks and SharePoint lists as structured data sources, SharePoint Online as a centralized, permission-controlled storage and versioning repository, and Power BI as the semantic modeling and visualization engine.
Through secure, native cloud connectors, Power BI accesses files hosted in SharePoint document libraries, processes the data through automated Power Query transformations, and delivers dynamic, interactive dashboards with automated cloud-based refresh intervals, eliminating manual reporting overhead.
Key takeaways
- Decoupled responsibilities: Excel remains the operational engine for ad-hoc data entry and financial modeling; SharePoint acts as the secure, collaborative storage plane; and Power BI serves as the unified governance and analytics layer.
- Automated data refresh: Hosting source files in SharePoint Online allows the Power BI service to execute scheduled cloud-based refreshes without requiring an on-premises data gateway.
- Unified metrics: Consolidating Excel data into centralized Power BI semantic models prevents KPI discrepancies across departments.
- Low-code migration path: Leveraging SharePoint document libraries and SharePoint Lists provides a structured, low-risk transitional path from manual spreadsheets to formal database platforms.
- Security alignment: Data security is maintained end-to-end by aligning SharePoint folder access rights with Microsoft Entra ID and Power BI Row-Level Security (RLS).
When Should Enterprises Integrate Excel, SharePoint, and Power BI?
Before committing budget to a full data platform modernization, enterprise architects must evaluate whether their current reporting scale fits a file-and-list-driven architecture or requires a dedicated data warehouse.
Analytical Scale and Solution Alignment Matrix
| Business Scenario | Data Complexity | Recommended Architectural Approach |
| Small Team Reporting | Individual files, basic flat sheets, datasets under 50 MB. | Excel + Power BI: Use local workbooks with simple Import modes and manual desktop refreshes. |
| Departmental Dashboards | Shared operational tracking, collaborative workflows, multiple users. | SharePoint + Power BI: Host files in SharePoint Document Libraries or utilize SharePoint Lists with cloud-scheduled refreshes. |
| Multi-Departmental & Multi-Entity BI | Disconnected data domains, cross-functional KPI tracking, shared master data. | Power BI Dataflows + Semantic Models: Extract SharePoint data once into cloud Dataflows to prevent API throttling and build certified downstream semantic models. |
| Enterprise Data Modernization | Multi-TB datasets, heavy historical queries, continuous AI/ML modeling, external databases (ERP/CRM). | Microsoft Fabric + Power BI: Streamline pipelines via OneLake and query data instantaneously through Direct Lake mode, bypassing SharePoint limits. |
Why Excel-Based Reporting Fails at Enterprise Scale
Excel remains a fundamental business tool, but it was never designed to operate as a relational enterprise database or a multi-user collaborative platform. At scale, spreadsheet-centric reporting models inevitably hit clear operational limits.
1. The proliferation of spreadsheet data silos
When departments manage operational tracking in isolated, local Excel workbooks, version control breaks down. Files are frequently duplicated, renamed, and distributed via email threads (e.g., Q2_Sales_v3_Final_EDITED.xlsx). This decentralized structure makes it impossible to establish a single, trusted source of truth, resulting in conflicting metrics and misaligned business decisions.
2. Manual reporting and consolidation drag
Compiling monthly or quarterly executive reports typically requires manual copy-paste workflows. Analysts spend critical working hours opening dozens of regional spreadsheets, reconciling format discrepancies, manually adjusting values, and recalculating summary statistics. This tedious process is prone to human error and introduces significant reporting latency, providing leadership with lagging historical performance metrics instead of real-time operational insights.
3. Lack of systemic data governance
Spreadsheet-based models lack native database security and centralized metric logic. A single accidental cell modification or formula deletion can silently corrupt an entire reporting pipeline. Furthermore, raw files are often shared without access audits, exposing highly sensitive financial or personnel records to unauthorized internal and external parties.
How SharePoint Extends Excel for Enterprise Data Management
Before introducing Power BI, organizations must establish a controlled data storage plane. SharePoint Online extends basic Excel functionalities by introducing structured document management and centralized governance.
SharePoint as a governed document repository
Moving files from local hard drives to SharePoint Document Libraries establishes immediate, enterprise-grade file controls:
- Version control: SharePoint automatically logs file modifications, allowing administrators to review historical revisions, audit user changes, and roll back files to previous safe states.
- Co-authoring and collaboration: Multiple users can modify operational data concurrently within a single web browser session, eliminating the "locked for editing" file bottleneck.
- Granular folder permissions: Document libraries inherit Entra ID security permissions, restricting access to sensitive datasets based on corporate roles.
SharePoint lists as structured data sources
For processes requiring basic data entry without complex Excel formulas (such as asset logs, employee directories, or simple project tracking), SharePoint Lists provide a more robust alternative to spreadsheets. SharePoint Lists can support large operational datasets, but they are not designed to replace enterprise databases for analytical workloads. They enforce standardized columns, drop-down choice validations, and audit trails, preventing users from entering unstructured, invalid, or corrupt data strings.
Power BI SharePoint Integration Architecture
SharePoint is often the first step in enterprise BI modernization because it provides controlled ownership, permissions, and collaboration before organizations move data into dedicated analytics platforms. To prevent performance degradation, the integration must follow a structured hierarchy:
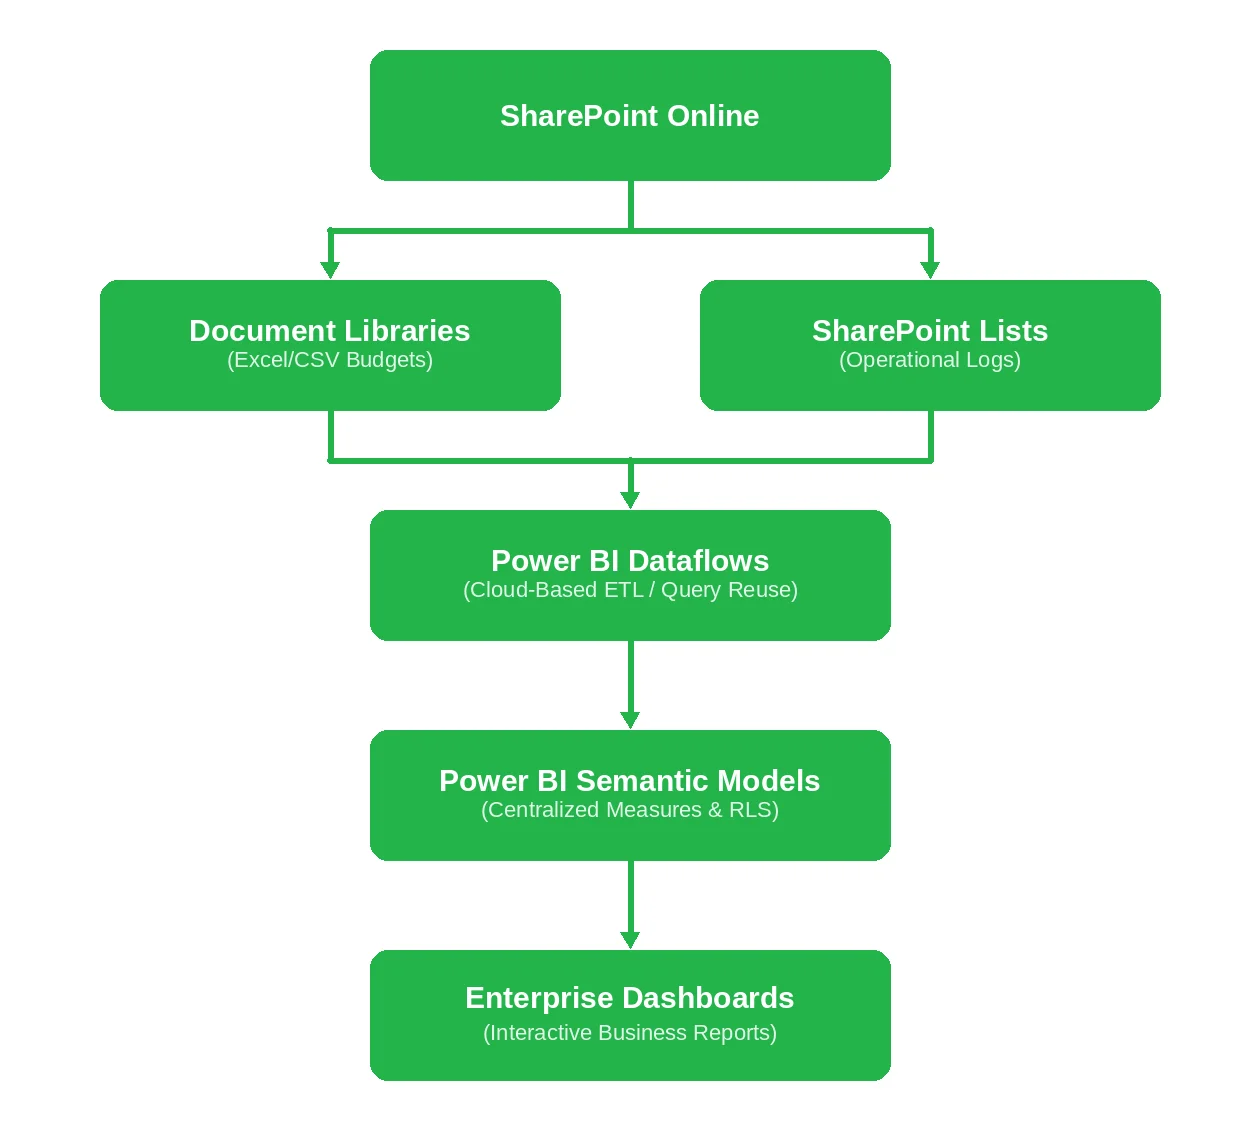
By leveraging cloud-based Power BI Dataflows as an intermediary layer, the architecture extracts data from SharePoint once. This processed data is stored as standardized, reusable tables in Azure Data Lake Storage, completely avoiding API throttling and rate-limiting issues on the SharePoint source site when multiple developers build reports.
Excel vs. SharePoint vs. Power BI: Functional Comparison
To design an effective analytics ecosystem, architects must map the functional capabilities of Excel, SharePoint, and Power BI to their appropriate operational roles.
| Operational Capability | Microsoft Excel | SharePoint Online | Microsoft Power BI |
| Data Entry and Editing | High. Optimized for rapid tabular inputs and formulas. | Medium. Supported via SharePoint Lists and forms. | None. Read-only analytics engine (by design). |
| Document Version Control | Limited to basic local auto-save features. | High. Standard, automated cloud-level versioning. | Advanced. Supported via Git integration and ALM. |
| Data Ingestion and ETL | Basic Power Query for single desktop workbooks. | None. Limited to document storage and list routing. | High. Scalable, enterprise-class cloud-to-cloud ETL. |
| Data Scale Limits | Up to 1,048,576 rows per worksheet | Large libraries (up to 30 million items under view limits). | High-scale, highly compressed in-memory columnar engine. |
| Interactive Dashboards | Basic, static charts and PivotTables. | Basic web parts and portal views. | Advanced. Rich, interactive, cross-filtered visuals. |
| Granular Security | Low (unreliable workbook passwords). | Medium (site, library, and folder-level access controls). | High. Row-Level Security (RLS) and Purview classification. |
Step-by-Step: How to Connect Excel and SharePoint to Power BI
Connecting your Excel and SharePoint assets to Power BI involves a systematic pipeline that transforms raw tabular rows into clean, governed semantic models.
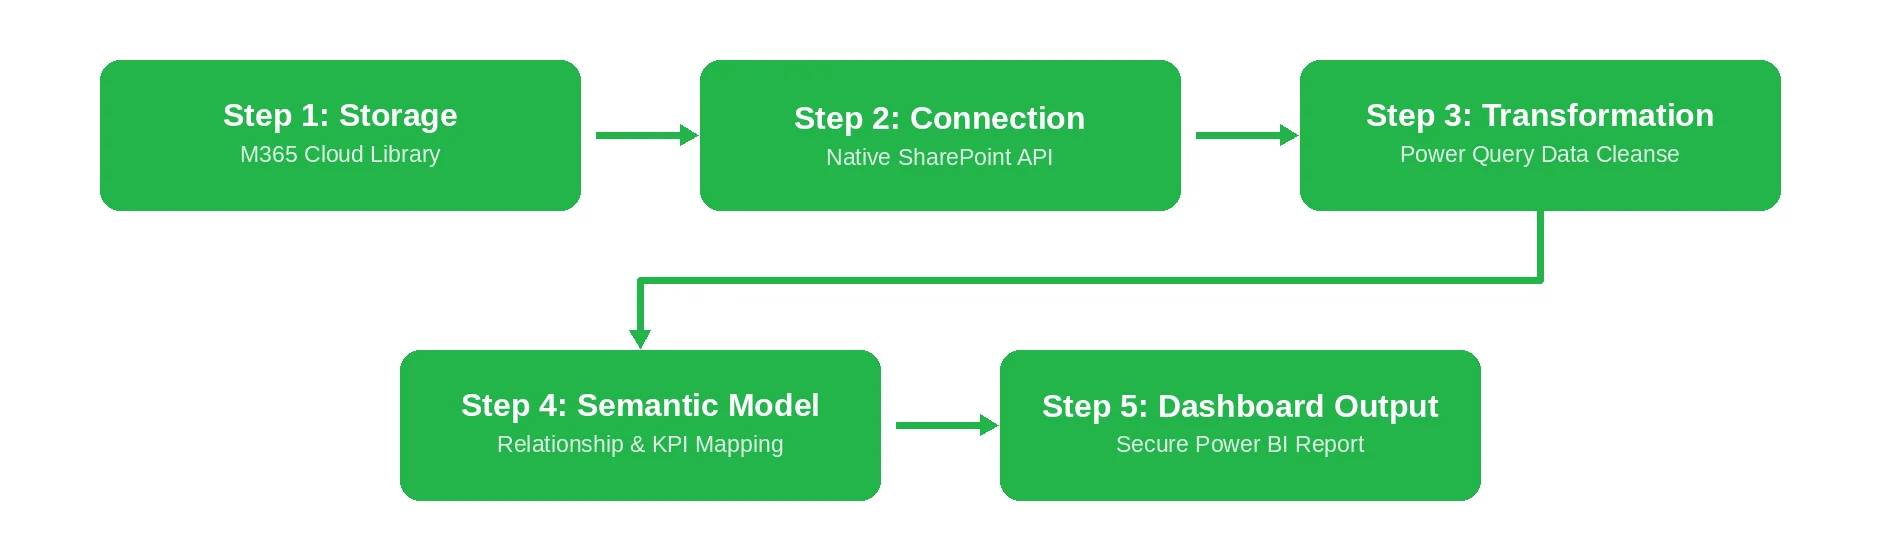
Step 1: Standardize and store data in Microsoft 365 cloud library
First, ensure your source Excel workbooks are cleaned of merged cells, blank rows, and multiple data tables on a single tab. Save the structured files inside a designated SharePoint Online Document Library or configure a collaborative SharePoint List.
Step 2: Connect Power BI desktop using native web APIs
Open Power BI Desktop. Avoid using local folder paths (such as C:\Users\...) as this prevents automated cloud refreshes. Instead, establish a secure web connection using the appropriate native connector:
- For Excel files in SharePoint: Copy the file path from SharePoint (excluding the ?web=1 suffix) and connect via the Web Connector. Alternatively, use the SharePoint Folder Connector to automatically merge multiple matching files hosted in a single directory.
- For SharePoint lists: Choose the SharePoint Online List Connector and input your root SharePoint Site URL.
Step 3: Clean and transform data in Power Query
Once connected, utilize Power Query to shape and cleanse the data. Typical steps include:
- Promoting the top row to column headers.
- Defining explicit data types (e.g., converting text numbers to Decimal formats).
- Unpivoting wide, cross-tabulated columns into clean, narrow attribute-value pairs.
- Removing extraneous summary rows and formatting anomalies.
Step 4: Build a governed semantic model
Load the cleansed data tables into the Power BI memory space. Establish formal relationships (one-to-many star schemas) between your fact tables (e.g., Sales, Transactions) and dimension tables (e.g., Customers, Dates). Define certified corporate calculations using Data Analysis Expressions (DAX) and configure required Row-Level Security (RLS) rules.
Step 5: Publish and schedule cloud refreshes
Publish the completed report file to your secure Power BI Workspace. Navigate to the dataset settings in the Power BI Service, input your Microsoft 365 OAuth 2.0 credentials, and configure a scheduled refresh pattern (up to 8 times daily on Pro, or 48 times daily on Premium/Fabric capacities). Power BI will query SharePoint Online directly over Microsoft's cloud backbone, entirely bypassing the need for local data gateway installations.
Enterprise Architecture: Excel + SharePoint + Power BI
To scale this integration pattern across multiple business divisions, organizations must transition from basic file imports to a managed, hub-and-spoke enterprise data pipeline.
Architectural flow breakdown
1. Ingestion layer
Data resides in distributed operational files—such as departmental Excel budget trackers or operational SharePoint Lists—stored securely in SharePoint Online document libraries.
2. Intermediate ETL layer (Dataflows)
Instead of connecting individual Power BI reports directly to the same Excel files, organizations construct Power BI Dataflows. Dataflows run Power Query transformations in the cloud, extracting data from SharePoint and storing it as standardized, reusable tables in Azure Data Lake Storage Gen2. This prevents multiple reports from querying the same SharePoint files simultaneously, reducing rate-limiting bottlenecks.
3. Semantic layer (Unified Datasets)
A centralized semantic model imports the processed data directly from the Dataflow layer. This is where corporate KPIs, fiscal calendars, and row-level access permissions are configured and validated.
4. Visualization and consumption layer
Report developers connect their Power BI report layouts to the centralized semantic model using Live Connections. End-users across the enterprise consume the reports through secure browser windows, mobile applications, or embedded Microsoft Teams tabs, ensuring everyone views the exact same metrics.
When Excel and SharePoint Are Not Enough: Moving Toward Microsoft Fabric
While Excel and SharePoint are effective operational data sources, organizations managing millions of records, multiple enterprise platforms, and complex analytical workflows often outgrow a document-driven architecture.

Microsoft Fabric extends this infrastructure by providing a unified, SaaS-based data platform. Instead of managing dozens of isolated files, Fabric ingests Excel data, SharePoint Lists, SAP transactional records, and CRM pipelines directly into a single, open data store called OneLake. From there, Power BI semantic models can query the data instantaneously through Direct Lake mode, completely bypassing SharePoint API throttling limits and removing the overhead of scheduled refresh windows.
Business Benefits of Excel + SharePoint + Power BI Integration
Organizations that transition from manual reporting to an automated, integrated Microsoft analytics framework achieve significant operational improvements:
- Elimination of reporting latency: Automated cloud-to-cloud data refreshes eliminate manual consolidation cycles, shifting your finance and operations teams from retrospective reporting to real-time analysis.
- Unified analytical consistency: Centralizing DAX calculations and data schemas ensures that all departments query the same verified metrics, preventing conflicting reports and improving decision-making accuracy.
- Optimized total cost of ownership (TCO): Leveraging existing Microsoft 365, SharePoint, and Power BI licenses allows organizations to deploy a highly capable analytics platform without purchasing expensive, separate third-party software.
- Reduced key-person dependency: Standardizing report definitions within the Power BI Service ensures that your corporate reporting remains functional and accessible, even if the original creator of a spreadsheet leaves the organization.
Implementation Challenges and How to Mitigate Them
While Microsoft provides native connection capabilities, building a scalable architecture requires addressing several common integration friction points:
Challenge 1: Unstructured data inside Excel workbooks
- The problem: Excel files with inconsistent column structures, merged header cells, empty rows, or nested subtotals cause Power Query errors and break automated data refreshes.
- Mitigation: Enforce strict data entry guidelines. Convert raw Excel spreadsheets into formalized Excel Tables (Ctrl+T) to lock in column names and schema structures, preventing users from breaking downstream connections.
Challenge 2: API throttling under heavy query loads
- The problem: When dozens of independent Power BI reports query the same high-volume SharePoint Document Library or SharePoint List simultaneously, SharePoint triggers API rate-limiting blocks, causing refresh failures.
- Mitigation: Decouple your reporting from the raw files. Implement a centralized Power BI Dataflow to ingest and process the files once, storing the standardized output tables in Azure Data Lake Storage for your reports to query.
Challenge 3: Inconsistent data ownership and lifecycles
- The problem: When spreadsheets are used as long-term data sources, they often become unmanaged over time. The original authors leave the business, and nobody knows who is responsible for updating the files.
- Mitigation: Establish a formal data governance policy. Document ownership for every file-based data source, set up automated notifications for missing files, and treat spreadsheets as a transitional state while planning a migration to proper database platforms.
Challenge 4: Insecure access control over sensitive datasets
- The problem: Highly sensitive spreadsheets are accidentally shared with broad Microsoft 365 groups, leading to internal data leaks and compliance violations.
- Mitigation: Implement strict access security policies. Rely on SharePoint Online's native file permissions to control editor access, and deploy Row-Level Security (RLS) inside the Power BI semantic model to restrict viewer access based on Entra ID roles.
Excel and SharePoint to Power BI Migration Roadmap
To transition your organization from manual, spreadsheet-centric reporting to a modern, governed analytics platform, follow this structured, five-phase migration framework:
Phase 1: Portfolio assessment and discovery
Conduct a comprehensive inventory of your organization's current spreadsheets, SharePoint lists, and operational dashboards. Document data sources, evaluate the complexity of local calculations, and identify redundant files to define a clear migration scope.
Phase 2: Target architecture and schema design
Define your target data structures, OneLake folder topologies, and workspace boundaries. Establish clear document naming conventions, map Microsoft Entra ID groups, configure your cloud capacities, and select the optimal Power BI connection methods.
Phase 3: Data cleansing and pipeline deployment
Clean your legacy data files, converting unstructured sheets into structured Excel tables. Build reusable Power BI Dataflows to handle cloud ingestion, configure secure SharePoint site linkages, and establish standardized transformation pathways.
Phase 4: Semantic modeling and dashboard development
Consolidate your cleansed tables into high-performance star-schema semantic models. Write and validate standard corporate calculations using DAX, configure Row-Level Security rules, and design interactive, cross-filtered dashboards tailored to your target user personas.
Phase 5: Training, optimization, and governance
Deploy role-based training programs across your departments to drive user adoption. Monitor your workspace performance, schedule automated data refreshes, and establish continuous data quality audits to ensure long-term platform health.
How Long Does Excel SharePoint Power BI Integration Take?
The timeline required to build and automate your reporting environment depends on the scope of data sources and the complexity of the underlying calculations.
Typical Modernization Timelines
| Project Scope | Estimated Duration | Core Focus Areas | Key Deliverables |
| Single Dashboard Automation | 2–4 Weeks | Single-source file connection, standard Power Query cleaning, and visual report design. | Automated, auto-refreshing operational dashboard. |
| Departmental Reporting Migration | 1–3 Months | Multi-file consolidations, SharePoint List integration, Dataflow architecture setup, and RLS deployment. | Unified departmental workspace with certified semantic models. |
| Enterprise BI Modernization | 3–6+ Months | Group-wide database assessments, cross-functional KPI standardization, Git-integrated ALM, and Microsoft Fabric planning. | Governed M365 analytics portal, centralized governance, and enterprise-grade security structures. |
Enterprise Use Cases
Integrating Power BI, Excel, and SharePoint delivers major operational value across a wide range of corporate functions:
1. Corporate financial forecasting and variance analysis
Finance teams can maintain their operational budgeting and rolling forecast models inside secure SharePoint-hosted Excel workbooks. Power BI connects directly to these files, automatically compiling actual ledger expenditures from your ERP with current forecast updates to deliver real-time variance analysis dashboards to leadership.
2. Multi-departmental project management and milestone tracking
Project Management Offices (PMOs) can utilize SharePoint Lists to track project statuses, risk logs, resource requirements, and milestone updates across separate teams. Power BI consolidates these lists into a single executive-level report, automatically highlighting critical-path delays and project health metrics.
3. Regional sales pipelines and performance tracking
Sales managers can track localized leads, pipeline stages, and conversion goals within standard SharePoint-hosted Excel spreadsheets. Power BI consolidates these regional trackers into a unified executive dashboard, providing real-time visibility into pipeline performance without manual document consolidation.
Why Choose Emerline for Power BI and Microsoft 365 Analytics Solutions
Transitioning your corporate reporting environment away from fragmented spreadsheets and manual files into an automated, secure, and unified Power BI analytics platform requires an experienced engineering partner with deep capabilities across the entire Microsoft 365 and Power Platform stack.
Establishing a scalable analytical foundation demands more than simply creating basic dashboards; it requires aligning your entire data architecture to protect operational margins, eliminate compliance vulnerabilities, and support long-term business growth. Minor architectural mistakes during model design or security configuration can result in reporting discrepancies, performance bottlenecks, and unauthorized data exposure.
As a Microsoft Solutions Partner with deep capabilities across the enterprise cloud and data engineering ecosystem, Emerline helps mid-market and enterprise businesses convert traditional, manual reporting tasks into smooth, automated corporate operations. We focus on optimizing your underlying data pipelines, ensuring your modern analytics architecture supports rapid business growth while completely removing technical debt from your core platforms.
Our elite data engineering and analytics teams collaborate directly with your product owners, security officers, and technology leads to clean technical debt, integrate siloed line-of-business platforms, and deploy performant cloud-native solutions tailored to your exact regulatory and operational constraints.
Emerline provides comprehensive end-to-end support for your data modernization:
- Power BI architecture design: Building highly optimized, scalable, and secure semantic models and workspaces tailored to your data footprint.
- M365 & SharePoint integration: Standardizing file storage, configuring secure document libraries, and establishing high-performance SharePoint List connections.
- Dataflow & pipeline engineering: Rebuilding manual consolidation tasks into automated, cloud-to-cloud Power Query and Dataflow pipelines.
- Governance and security configuration: Implementing tenant-wide security roles, data classification policies, and Microsoft Purview integration.
Contact our enterprise BI architects today to schedule a comprehensive Power BI and Microsoft 365 analytics assessment, identify automation opportunities in your workflows, and build a secure, automated source of operational truth.
Frequently Asked Questions
How do Excel and SharePoint integrate with Power BI?
Power BI utilizes native, secure cloud connectors to read data from Excel files stored in SharePoint document libraries or from SharePoint Lists. Power BI processes this data through automated Power Query steps and loads it into secure semantic models to deliver interactive, automatically refreshed reports.
Can Power BI automatically update Excel data?
Yes. When Excel source files are hosted in supported cloud locations like SharePoint Online or OneDrive for Business, the Power BI service can execute automated, scheduled refreshes to import the latest spreadsheet data without requiring manual file uploads.
Can SharePoint replace a data warehouse for Power BI?
No. While SharePoint can serve as a highly effective operational data source for departmental reporting, it is not designed to replace enterprise data warehouses. Organizations managing millions of records or requiring complex cross-functional analysis typically integrate Power BI with dedicated platforms like Microsoft Fabric or Azure data services.
What is the best architecture for Excel Power BI integration?
The recommended enterprise architecture decouples data storage, transformation, semantic modeling, and visualization. Excel and SharePoint function as operational source layers, Power BI Dataflows handle cloud ingestion and staging, a centralized semantic model hosts the standard metrics and security rules, and final reports connect via Live Connections.
Can Power BI completely replace Excel for business reporting?
No. Power BI does not replace Excel. Excel remains the primary tool for financial modeling, data entry, and detailed ad-hoc calculations. Power BI acts as a complementary layer, consuming Excel-generated data to provide centralized metric governance, high-scale storage, and interactive visualization.
Published on Jul 24, 2026